In today’s competitive food industry, restaurant operations are the cornerstone of efficiency, profitability, and long-term success. While innovative menus and creative marketing strategies may attract diners, it’s operational excellence that keeps them coming back. Regular operational assessments are crucial for identifying areas where your restaurant can streamline processes, cut costs, and improve the overall guest experience.
Take the case of Domino’s Pizza. In the late 2000s, the company faced declining sales and customer dissatisfaction. Beyond a mere menu overhaul, it was an in-depth operational assessment that uncovered inefficiencies in ordering and delivery processes. By leveraging technology, including a digital ordering platform and real-time order tracking, Domino’s enhanced customer satisfaction while significantly boosting profitability. These operational improvements helped re-establish Domino’s as a leader in the fast-food industry.
So, what should restaurant owners focus on during operational assessments? Key metrics like labor costs, inventory management, and cash flow analysis are essential for identifying inefficiencies. But knowing when to evaluate these areas is just as important. Scheduling regular assessments ensures that your restaurant is consistently optimizing its operations.
In this guide, we’ll walk through the essential metrics to evaluate during your operational assessments and discuss why frequent evaluations are key to staying competitive in today’s market.
Financial Health: The Backbone of Restaurant Success
Understanding the financial health of your restaurant is vital to long-term success. During operational assessments, restaurant operators should focus on the following financial metrics:
Revenue and Profit Margins: Regularly reviewing gross profit, net profit, and operating expenses helps identify potential problems before they spiral. A steady decline in profit margins might signal rising food costs or ineffective menu pricing. In these cases, adjustments like portion control or renegotiating supplier contracts can keep margins stable.

Cash Flow Analysis: Healthy cash flow is necessary for covering daily operations and investing in growth. By conducting cash flow assessments, you can identify challenges such as delayed vendor payments or seasonal dips in sales. These proactive insights allow for strategic decisions before any disruptions impact the bottom line.
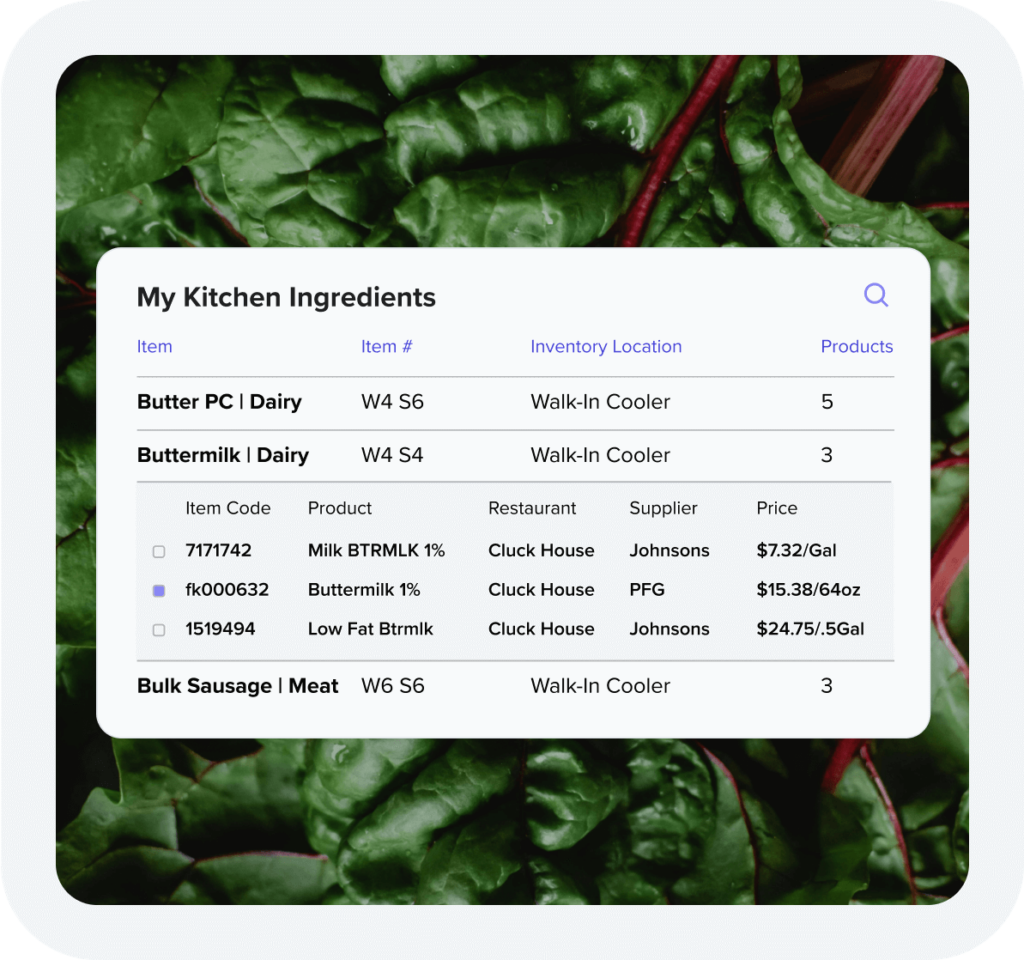
Cost of Goods Sold (COGS): Monitoring COGS helps identify inefficiencies in food and beverage costs, from over-purchasing to waste or spoilage. Regular review reveals when to implement better inventory management practices, negotiate supplier terms, or adjust menu pricing to improve margins.
Profit and Loss (P&L) Statements: A well-organized P&L report can track restaurant performance over time and reveal areas for optimization. By analyzing P&L statements, you gain the insight necessary for long-term strategic planning, helping to forecast future performance accurately.
For example, Figueroa Philly, a Southern California cheesesteak restaurant, faced mounting challenges with food cost management, which strained profitability. Owner Danny Hizami struggled with tracking ingredient costs and often made purchasing decisions based on intuition rather than concrete data. After adopting Back Office’s food cost management platform, Hizami was able to automate tracking, compare supplier prices, and optimize his inventory. The results were significant: a 5% reduction in food costs, greater financial clarity, and more time to focus on improving the customer experience. This transformation provided Hizami with the control and insights necessary for long-term success.
Labor Costs and Productivity: Maximizing Human Capital
A restaurant’s success relies heavily on its staff, and restaurant industry experts expect the current labor shortages to continue. Reframing labor cost management as an investment in the well-being of your team, and the technology at their fingertips, improves both morale and productivity. Offering competitive benefits, fostering a positive workplace culture, and creating opportunities for growth can further reduce turnover and help employees thrive.
Labor Cost Percentage: Tracking labor as a percentage of sales helps balance staffing with profitability. Further, regular analysis reveals whether labor costs are aligned with sales. High labor costs may indicate overstaffing, while lower percentages could suggest understaffing—both scenarios can negatively affect customer satisfaction and overall service quality.
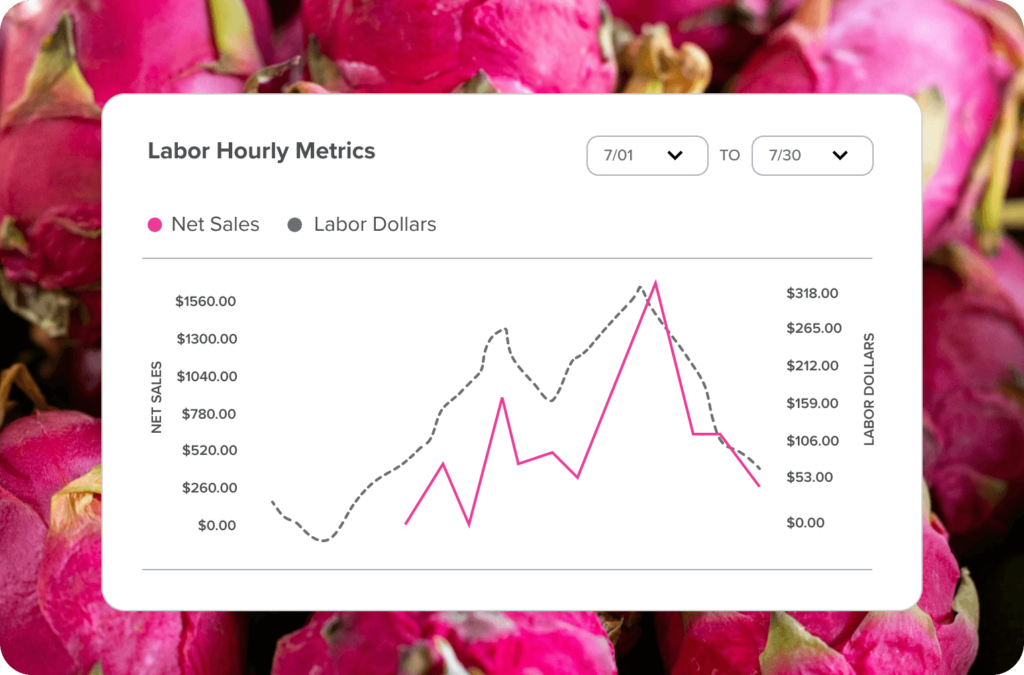
Our Sales and Labor Metric Analysis (SLA) report provides valuable insight into labor efficiency relative to revenue generation. You can make more informed decisions about staffing during peak and off-peak periods, optimizing labor costs without sacrificing service. Additionally, the Labor Cost Variance report highlights discrepancies between projected and actual labor costs. Understanding these changes allows you to adjust staffing and scheduling to better align labor costs with sales performance, reducing inefficiencies that could impact profitability.

Employee Productivity: Productivity assessments track far more than hours worked, evaluating just how effectively staff contribute to your restaurant’s goals. Investing in staff training or adopting technology solutions can improve productivity, leading to higher output per employee and an enhanced guest experience.
Staff Turnover Rates: High turnover can disrupt operational efficiency, impact team morale, and increase costs. Monitoring turnover rates and addressing retention through improved candidate screening and onboarding, competitive wages, growth opportunities, and a positive work environment helps stabilize labor costs and improve long-term success.
McDonald’s is a prime example of how balancing labor costs with employee productivity leads to operational success—even after employees leave the organization. Their recent “1 in 8” club and “Employees Only” event series celebrate past and present employees, emphasizing the company’s focus on retention and engagement. McDonald’s strategic approach to labor costs ensures that staffing is optimized for profitability while maintaining competitive benefits. With over 70% of employees attributing key skills like communication and leadership to their time at McDonald’s, the fast-food giant demonstrates how investing in human capital drives both workforce and business growth.
Inventory Management: Striking a Balance
Sometimes a product flies off the shelf; at other times, even deep discounts can’t move it. Most items, however, sit somewhere in the middle, making it crucial for restaurants to understand what’s selling and how quickly. The inventory turnover ratio sheds light on key factors like pricing strategy, supplier relationships, and promotional effectiveness.
A high turnover ratio can signal strong sales or insufficient stock (four to eight times per month is considered optimal), while a low ratio points to weak demand or excess inventory. Either way, mastering this metric helps steer your strategy with greater precision and foresight.

Inventory Turnover Ratio: Rather than just focusing on reducing waste, understanding this metric can help create a more responsive, efficient inventory system that supports customer demand and minimizes stock issues.
Stock Levels: Maintaining proper stock levels is also about avoiding overstock or stockouts, ensuring that employees have what they need to succeed. A well-managed inventory leads to smoother operations, more satisfied customers, and empowered staff who can deliver great service consistently.
This was a hard operations lesson learned by Red Lobster. The chain’s “Endless Shrimp” promotion, while successful in attracting traffic, became a financial and operational disaster. The promotion resulted in significant losses due to the high cost of shrimp, which exceeded the selling price, leading to inventory mismanagement and overwhelming demand that kitchens struggled to meet. This strain caused staff burnout, high turnover, and poor customer experiences, highlighting the impact of mismatched stock levels and demand on both employee success and operational efficiency. The company’s failure to balance inventory and labor needs underscores the importance of aligning promotions with sustainable stock management and staffing strategies to avoid financial and operational collapse.
Operational Efficiency: Streamlining Processes for Success
Operational efficiency goes beyond managing costs—it’s about improving every facet of restaurant operations to enhance the customer experience. Some of the key areas to focus on include:
Table Turnover Rates: Faster table turnover means more customers served, leading to higher revenues during peak periods. Streamlining workflows in the front-of-house and back-of-house can maximize table turnover without compromising service quality.
Order Accuracy: Order mistakes are not only frustrating for customers but costly for restaurants. Clear communication between front-of-house and kitchen staff, supported by technology solutions, can dramatically reduce errors.
Energy and Utility Usage: Monitoring energy usage and investing in energy-efficient equipment can significantly lower utility bills. During operational assessments, consider an energy audit to identify potential savings that can be reinvested in other areas.
Why Regular Assessments Matter
 In the fast-paced restaurant industry, success depends on the ability to continuously adapt and improve. Operational assessments should be an ongoing practice, allowing you to identify trends, address inefficiencies, and maintain excellence. Armed with the right metrics, restaurant owners can make data-driven decisions that optimize performance and profitability.
With the complexities of restaurant operations, consistent assessments and the right tools are key to staying competitive. Partnering with industry experts can help uncover hidden inefficiencies and drive lasting improvements. To ensure your restaurant’s long-term success, consider scheduling regular operational assessments and leveraging insights that keep your business ahead of the curve.

