

You can have a line out the door and still wonder where the money went. Maybe payroll ran over. Maybe produce spoiled in the walk-in. Restaurant monitoring helps you catch those things before they turn into a nasty surprise at month-end. You don’t need to live in spreadsheets. You just need to know what’s happening in your restaurant.
What Is Restaurant Performance Monitoring?
It’s checking in on the parts of the business that tell you how things are going: sales, staffing, food costs, inventory and cash. Restaurant monitoring is less about pulling reports and more about noticing when something looks off, then figuring out why.
Restaurant Monitoring vs. Reporting vs. Benchmarking
Here’s the difference. A report says you sold $8,000 last Tuesday. Monitoring tells you Tuesdays have been getting slower for a month. Benchmarking shows how that compares with your target or another similar store. They’re related, but they aren’t the same job.
Why Restaurant Performance Monitoring Matters
Identify Problems Early
Say your food cost is suddenly higher on Wednesdays. Is someone prepping too much? Did a delivery price change? Catching it this week beats discovering it after you’ve paid four weeks of invoices.
Control Operating Costs
A little extra waste here, a few unnecessary labor hours there—it adds up. When you keep an eye on the numbers, you can trace those costs back to what’s actually happening on a shift.
Protect Profit Margins
Busy doesn’t always mean profitable. You might be selling more meals but spending even more to make and serve them. That’s why sales and expenses need to be checked together.
Improve Operational Efficiency
Think about the shift that always feels overstaffed or the prep station that throws away half a pan at closing. The numbers can help you test whether that hunch is right.
Make Faster Business Decisions
When the schedule needs changing, you shouldn’t have to wait three weeks for the books to close. Current numbers give you something solid to work with.
Key Metrics Every Restaurant Should Monitor
There are plenty of things you could measure. Start with the ones that help you run tomorrow’s shift and keep the business healthy.
Sales and Revenue
Look beyond the total at the bottom of the POS report. Which shifts were busy? How many checks did you ring? Did that promotion bring in more sales or just discount the meals you would’ve sold anyway?
Prime Cost
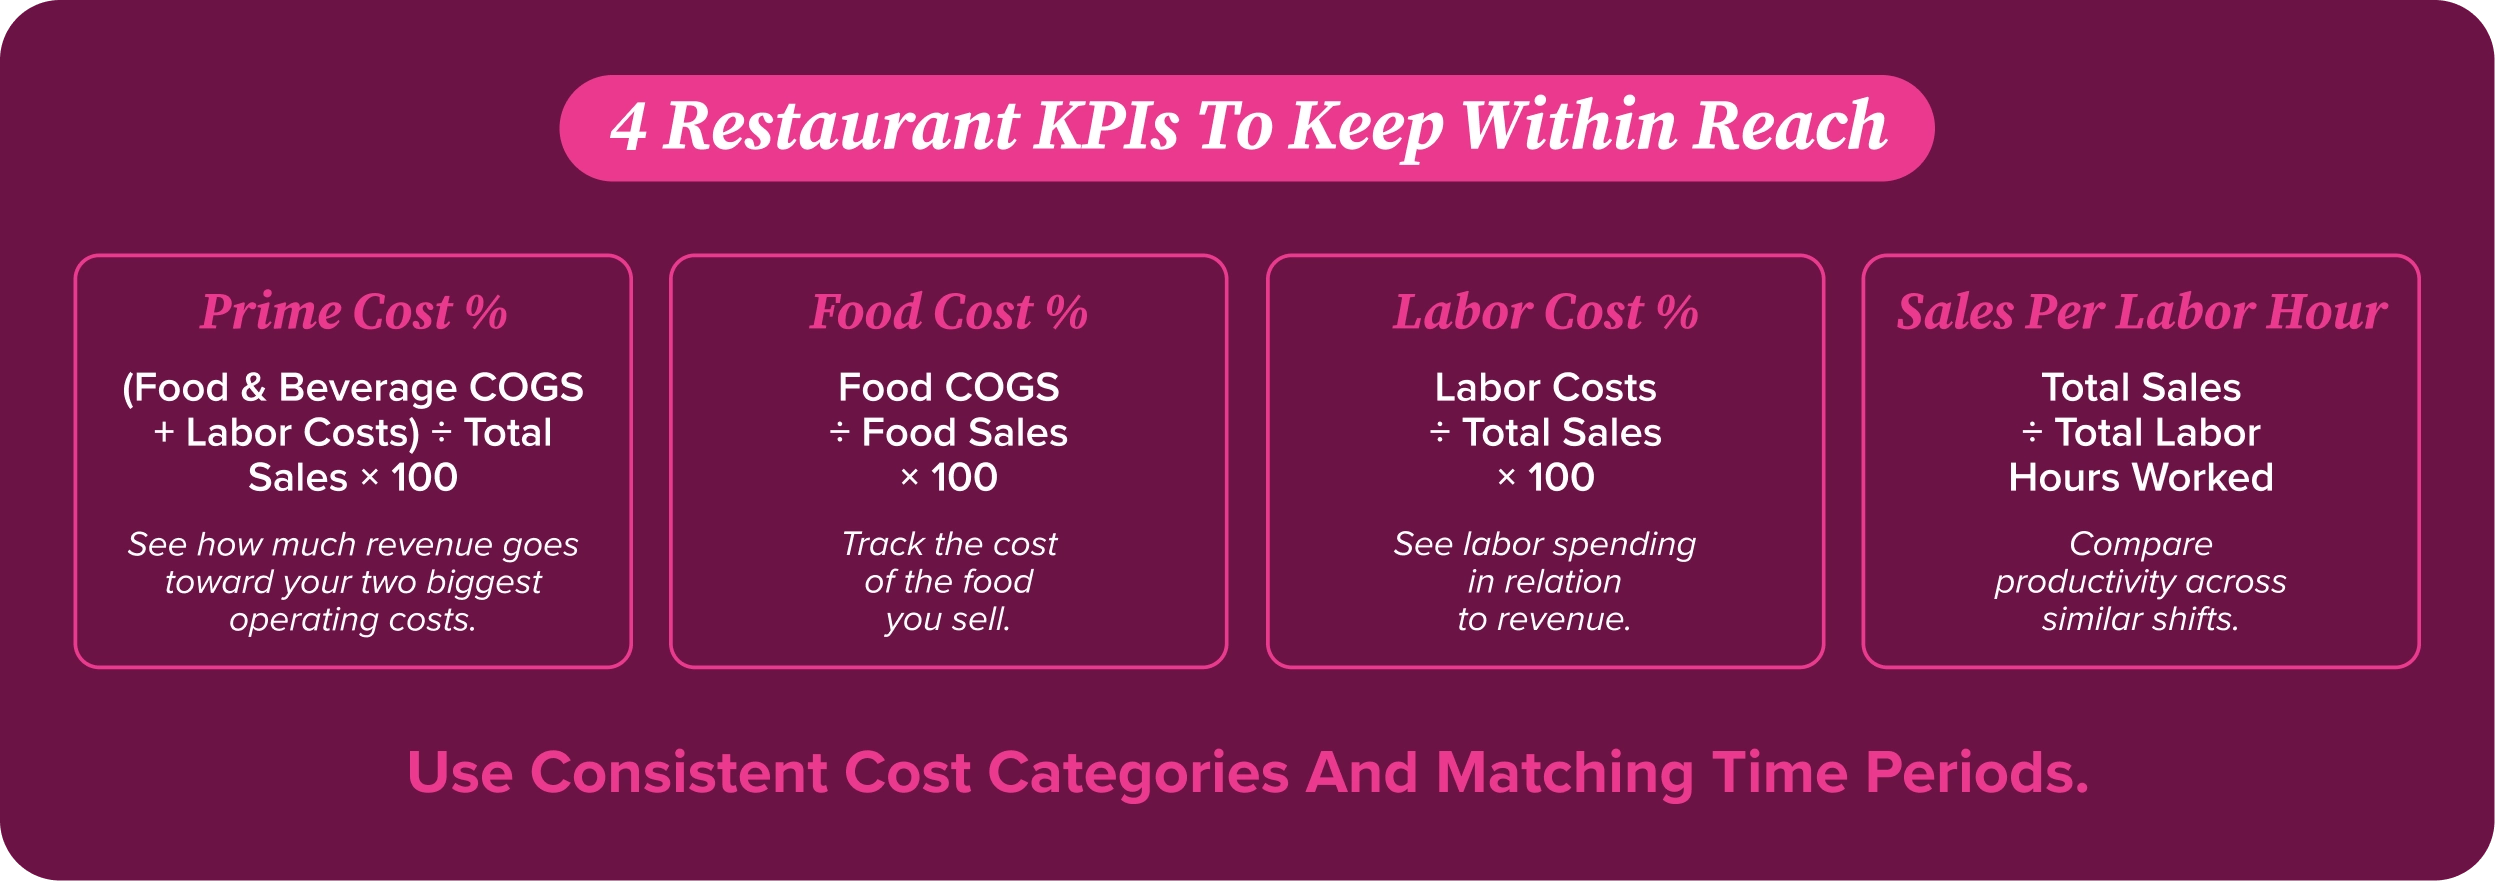
Add food and beverage cost of goods sold to labor costs, then divide by sales. That’s your prime cost percentage. It’s worth watching because those two costs can eat up a big piece of revenue.
Food Cost Percentage (COGS)
Food cost percentage is food COGS divided by food sales. If it goes up, don’t immediately blame the kitchen. Check invoices, recipes, portions and waste. The answer could be in any of them.
Labor Cost Percentage
Divide labor costs by sales to get your labor percentage. Use the same labor categories each time. And remember, cutting a shift too thin can cost you guests, even when the percentage looks better.
Cash Flow
You still need cash available when payroll hits and vendors expect payment. Watch what’s coming in, what’s going out and which bills are around the corner. Profit on a statement won’t pay Friday’s invoices by itself.
Sales per Labor Hour
Take sales for a shift and divide by hours worked. Then compare similar shifts. A slow lunch and a packed Saturday dinner shouldn’t be judged by the same expectations.
Inventory Variance (Actual vs. Theoretical)
Your recipes tell you how much product you should’ve used. Counts and purchases help show what actually got used. When those don’t line up, look at waste, portion sizes, recipe accuracy or bad counts.
Average Check Size
Divide sales by the number of checks. If average check drops, take a look at what guests are ordering and whether discounts or menu changes had something to do with it.
Guest Satisfaction
Don’t just watch star ratings. Listen to what servers hear and what regulars say. If guests keep mentioning long waits, that’s worth more attention than one cranky review.
Revenue per Available Seat Hour (RevPASH)
For dine-in restaurants, divide revenue by the number of seats available multiplied by the hours they’re available. RevPASH helps show whether your dining room is earning what it could during different parts of the day.
How Often Should You Monitor Restaurant Performance?
Some numbers need attention before the next shift. Others make more sense when you have a few weeks of results to compare.
Daily Restaurant Metrics
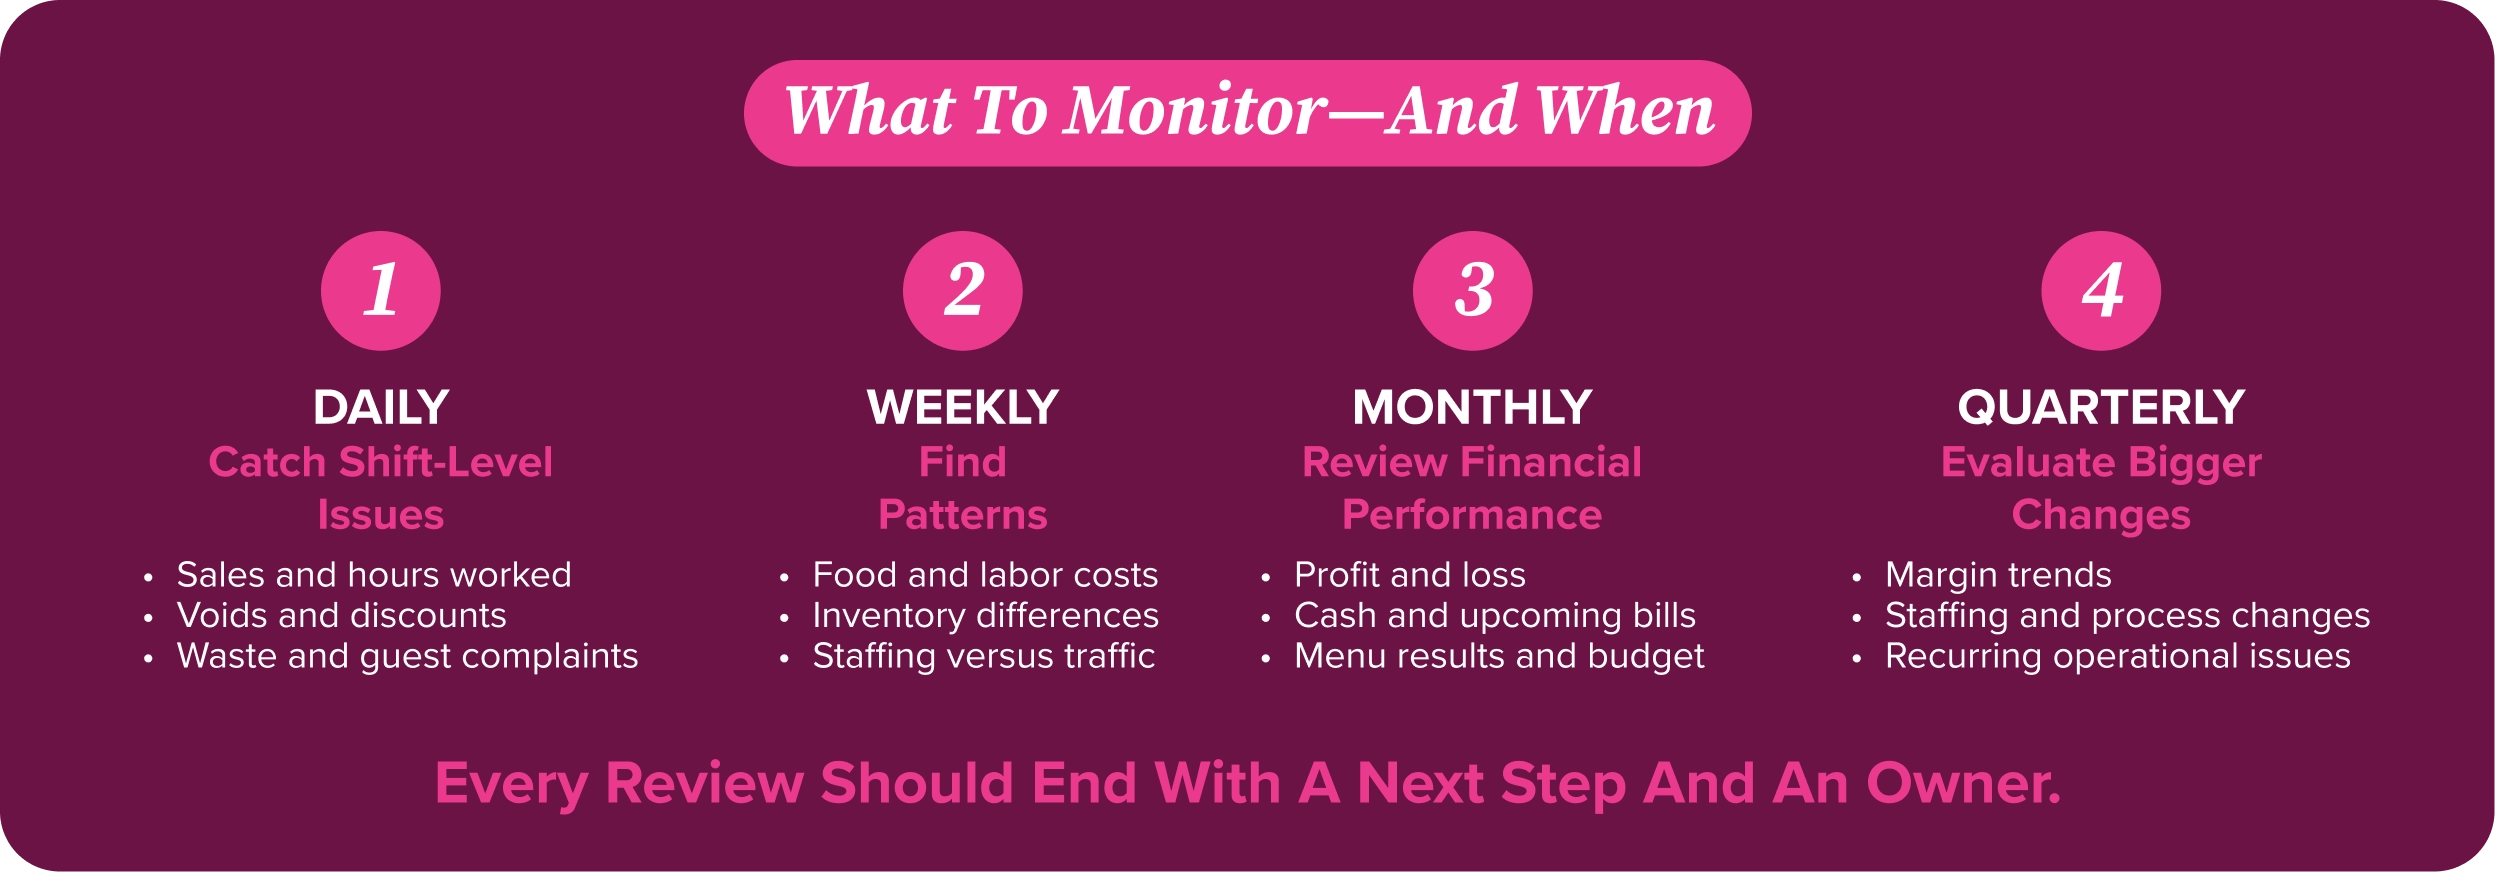
Before heading home, glance at sales, hours worked, voids, discounts, waste and any guest complaints. Write down what tomorrow’s manager needs to know.
Weekly Restaurant Metrics
Once a week, look at food and labor costs, inventory differences and whether your schedule matched traffic. One weird Tuesday happens. Four weird Tuesdays tell you something.
Monthly Restaurant Metrics
Take a closer look at your P&L, bills, cash, menu results and budget. Ask where the money went, not just whether sales were up.
Quarterly Performance Reviews
Every few months, pull back from the daily rush. Are staffing changes helping? Are margins moving the right way? What keeps coming up that nobody has fixed?
How to Set Up Restaurant Performance Monitoring
Centralize Sales, Labor, and Cost Data
If sales live in the POS, hours live in payroll and costs live in accounting, someone has to put the pieces together. Make that job as simple and repeatable as you can.
Define Key Performance Indicators
Pick a handful of numbers your managers can actually use. Agree on how each one is calculated and who’s responsible for checking it. Otherwise, two people can walk into a meeting with two different answers.
Set Benchmarks and Performance Targets
Your own sales history and budget are a better starting point than somebody else’s generic target. A counter-service lunch spot won’t run exactly like a full-service steakhouse.
Build a Recurring Reporting Cadence
Give the numbers a regular place on the calendar. A quick daily check, a weekly conversation, and a monthly financial review can do the job. End each one knowing who’s doing what.
Flag and Investigate Variances
When something misses the target, look into it. A higher food cost could be a pricing change, a count mistake, or bigger portions. Check before you start changing procedures.
Monitoring Performance Across Multiple Locations
If you run several stores, you need numbers you can compare without spending half the meeting explaining how each manager calculated them.
Comparing Units on Consistent KPIs
Make sure everyone uses the same formulas and time periods. Compare similar locations when possible. A downtown lunch shop and a suburban dinner restaurant have different traffic patterns.
Identifying Location-Level Outliers
One store’s labor keeps running high. Another’s food cost is unusually low. Both deserve a closer look. Sometimes the outlier is the store with a good idea everyone else can use.
Analyzing Performance Trends Across Locations
Watch where each location is headed, not only who’s on top this week. A store improving month after month may be doing something right even if it isn’t your highest seller yet.
Sharing Best Practices Across Units
If one kitchen cut waste by changing prep quantities, ask how they did it. Let the other managers try it rather than making everybody solve the same problem alone.
How to Turn Restaurant Performance Data Into Action
Identify the Biggest Performance Variances
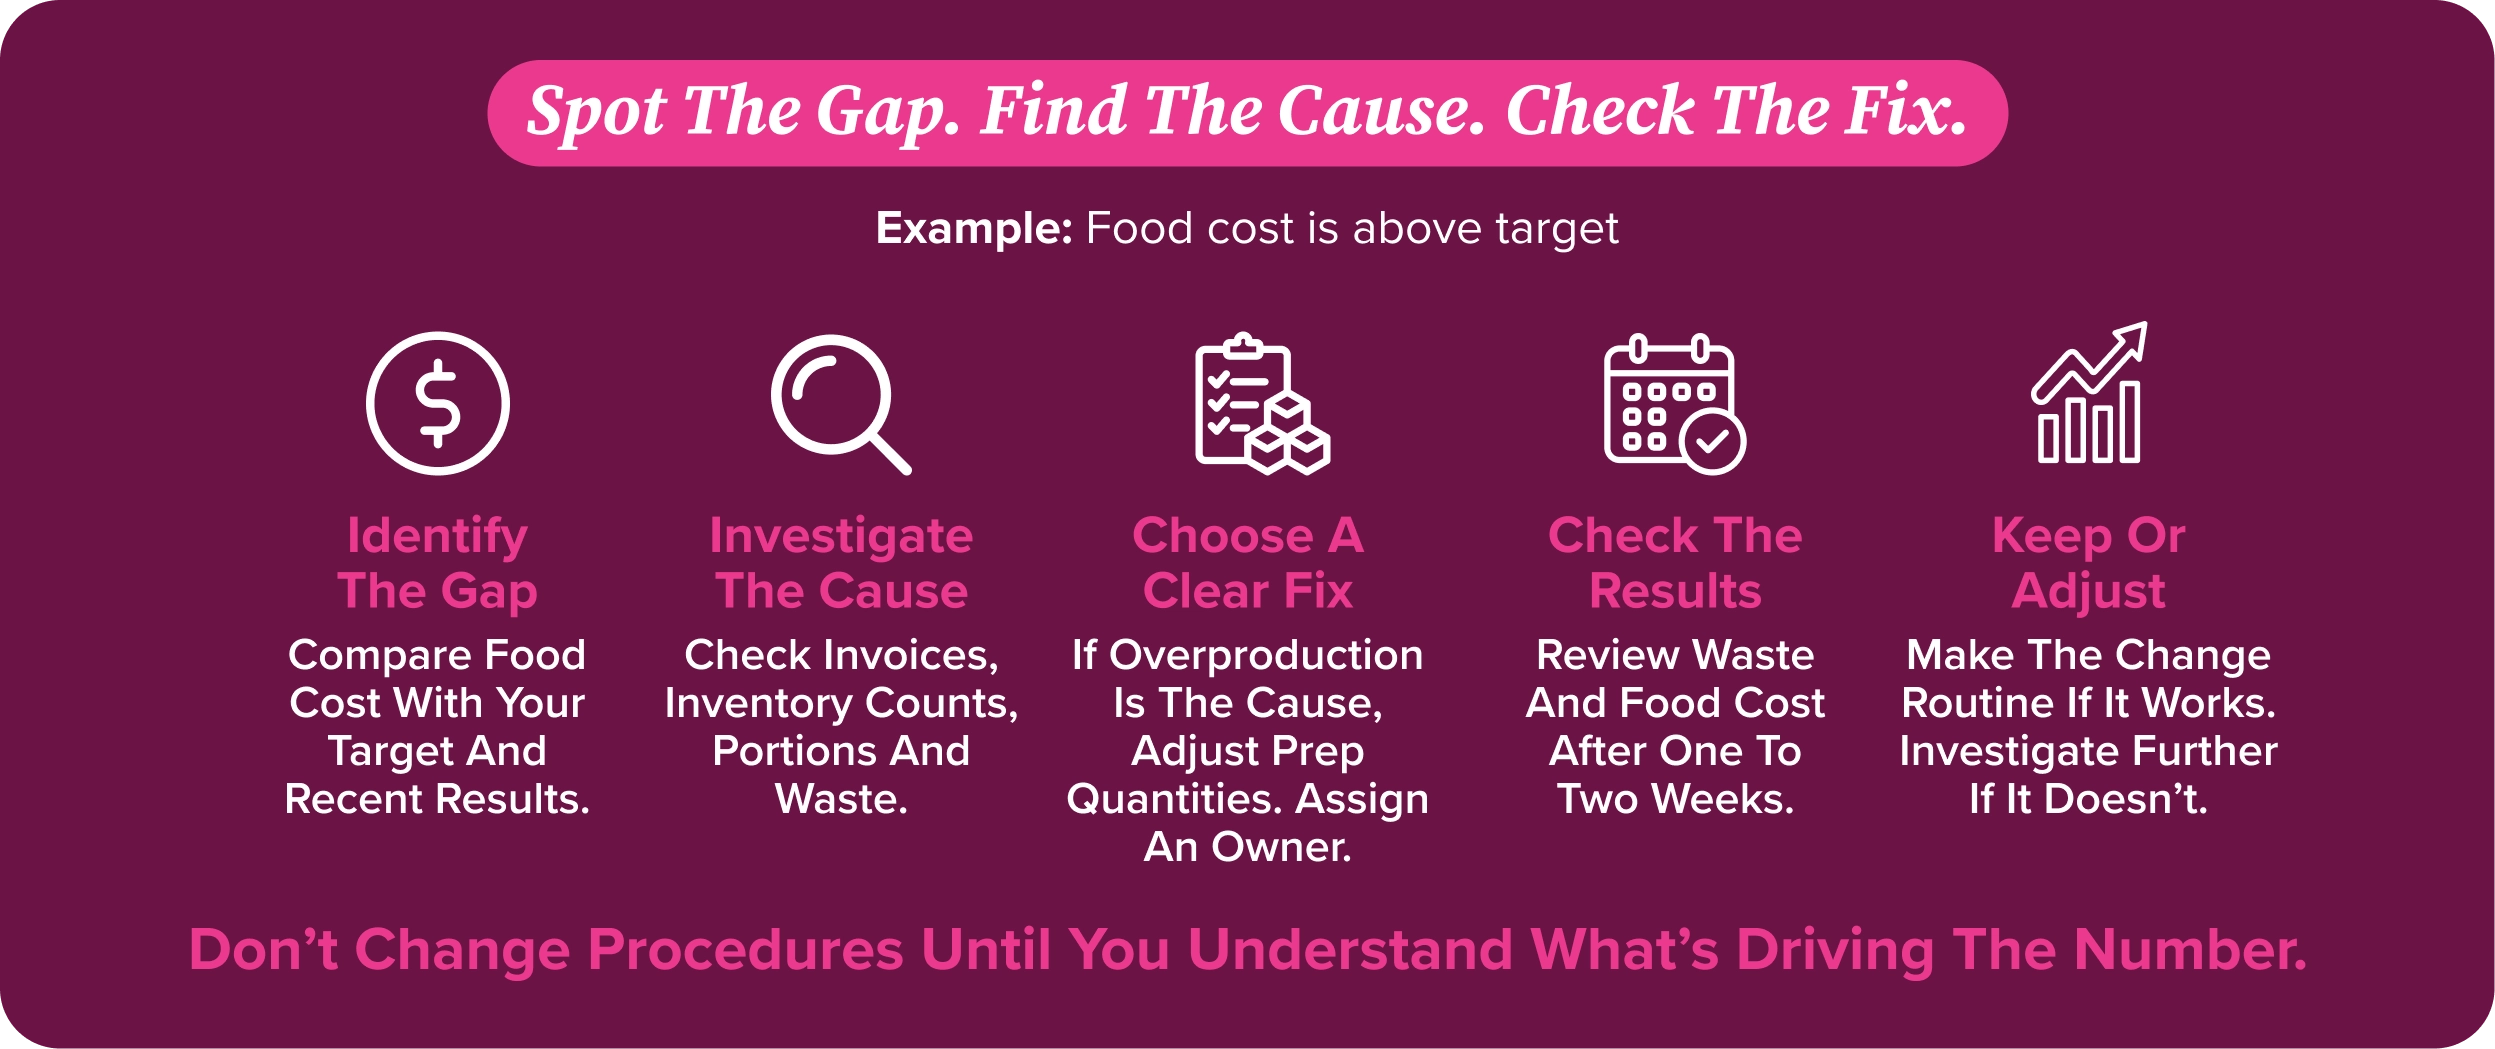
You don’t have to fix every number at once. Start with the gap that’s costing you the most or creating the biggest problem for the team.
Determine the Root Cause
Get into the details. If food cost is high, look at deliveries, counts and prep. Talk to the cooks and managers who worked those shifts. The spreadsheet doesn’t know everything.
Take Corrective Action
Choose one clear fix. Maybe it’s changing prep pars or checking portions at the line. Put someone in charge and set a date to look again.
Measure the Results
Did the change help? Check the same numbers after a week or two. If waste didn’t budge, you probably haven’t found the real issue yet.
Adjust Targets and Processes
Once something works, make it part of the routine. And when menu prices, staffing or demand change, revisit the target instead of sticking with an old number out of habit.
Common Restaurant Monitoring Mistakes
Tracking Too Many Metrics
A report with forty tabs isn’t much help if nobody knows where to look. Keep the important numbers front and center; dig deeper when you need to.
Reviewing Data Too Infrequently
If you only check labor at month-end, the overscheduled shifts have already happened. Look at costs often enough to change what happens next.
Using Inconsistent KPI Definitions
When one manager counts salaried supervisors as labor and another doesn’t, the stores aren’t really being compared. Use the same definitions everywhere.
Focusing Only on Revenue
A great sales week can still leave you short if food and payroll costs went through the roof. Revenue is only part of the story.
Ignoring Performance Variances
Don’t wave off a number just because the restaurant felt busy. Find out whether it’s a real pattern or a one-time event, then decide what to do.
Collecting Data Without Taking Action
If nobody acts on what the reports show, you’re just collecting numbers. Give each issue an owner and check back on it.
How BEP Back Office Powers Restaurant Performance Monitoring
Back Office by Buyers Edge Platform helps operators get a better handle on the financial side of running a restaurant. Instead of chasing numbers across different places, teams can spend more time looking at costs, reviewing results and figuring out what needs attention. When you can see what’s happening, it’s easier to have useful conversations about what to change next.
FAQ’s
What KPIs should restaurants monitor?
Start with sales, food cost, labor cost, prime cost and cash flow. Add guest feedback and inventory differences. The right mix depends on the kind of restaurant you run.
What should restaurants monitor daily?
Check sales, staffing hours, discounts, voids, waste and guest issues. Focus on anything you can address before the next shift.
How often should restaurant performance be reviewed?
Look at shift results daily, trends weekly and financials monthly. Every quarter, make time for the bigger questions that don’t get answered during dinner rush.
What’s a good prime cost for a restaurant?
There’s no magic percentage for every restaurant. Some operators use roughly 55%–65% of sales as a reference, but the right target depends on your concept, menu and labor model. Your own budget and history matter more.
What software helps monitor restaurant performance?
Your POS, scheduling, inventory and accounting systems all have a piece of the picture. Look for tools that make those numbers easier to pull together and understand. Back Office supports the financial side of restaurant monitoring.