

Sales were great this weekend. So why does it hurt to pay the next round of invoices? A busy dining room tells you something, but it doesn’t tell you what’s left over after food, labor, rent, and everything else. That’s where accounting metrics for restaurants come in. You don’t have to spend your night buried in spreadsheets. You need a few numbers you can trust, a regular way to keep an eye on them, and a good sense of what you’re looking for when things don’t seem right. Let’s start there.
Why Track Restaurant Accounting Metrics?
Understanding some common accounting metrics is essential for evaluating the financial health of your restaurant(s). These metrics provide a comprehensive view of performance, allowing you to make informed decisions about where to focus your efforts in maximizing the performance of your unit(s). By tracking these financial indicators, you can ensure your restaurant remains profitable and sustainable.
14 Essential Restaurant Accounting Metrics & Formulas
| Metric | Formula |
| Revenue and Sales Growth (%) | [Current Period Revenue – Previous Period Revenue] / Previous Period Revenue x 100 |
| Gross Profit Margin (%) | [Revenue – Cost of Goods Sold] / Revenue x 100 |
| Net Profit Margin | Net Income / Total Revenue x 100 |
| Food Cost Percentage | Cost of Goods Sold / Total Food Sales x 100 |
| Labor Cost Percentage | Total labor cost / Total revenue x 100 |
| Cost of Goods Sold (COGS) | Beginning Inventory + Purchases – Ending Inventory |
| Operating Expense Ratio | Total Operating Expenses / Total Revenue |
| Break-Even Point | Total Fixed Costs / Contribution Margin Ratio |
| Contribution Margin Ratio | [Total Revenue – Total Variable Costs] / Total Revenue |
| Working Capital | Current Assets – Current Liabilities |
| Current Ratio | Total Current Assets / Total Current Liabilities |
| EBITDA | Total Revenue – Operating Expenses + Depreciation + Amortization |
| Average Check Size | Total Revenue / Total Number of Guests |
| Table Turnover Rate | Total # of Parties Served / # of Tables in Restaurant |
What Each Metric Means & Healthy Benchmarks
What is healthy depends on your menu, service model, market, and accounting setup. “A full-service restaurant and a counter-service concept are not necessarily going to have the same targets. The following ranges are intended to serve as a starting point for budget conversations and should not be taken as verified 2026 industry averages or promises of profitability. Your own comparable periods and budget should do most of the benchmarking.
| Metric | What it tells you | Starting target or comparison |
| Revenue and sales growth | Whether sales are moving up or down. | Aim for positive growth against comparable periods; check whether price increases, rather than more guests, explain it. |
| Gross profit margin | Sales left after the cost of goods sold. | Compare with budget and your sales mix. Food-only cost of 28–35% implies food-only gross margin of 65–72%. |
| Net profit margin | The share of revenue left after all expenses. | Positive and at or above your budgeted margin. There’s no single healthy range for every concept. |
| Food cost percentage | How much food sales go toward food used. | Use roughly 28–35% as an initial planning range, then test it against your recipes, pricing, and menu mix. |
| Labor cost percentage | How much revenue goes toward your team. | Roughly 25–35% is a planning starting point. Include employer payroll taxes and benefits consistently; evaluate service quality, too. |
| COGS | The cost of inventory used during the period. | No standalone dollar target. Compare with sales and budget, using reliable inventory counts and consistent purchasing records. |
| Operating expense ratio | The portion of sales consumed by operating expenses. | At or below budget, without starving operations. Define included expenses consistently so comparisons actually mean something. |
| Break-even point | The sales needed to cover fixed and variable costs. | Actual sales above break-even, with a cushion. Use fixed costs and contribution margin from the same period. |
| Contribution margin ratio | The share of sales available for fixed costs and profit. | High enough to cover fixed costs at expected sales. Use it to assess promotions before discounting. |
| Working capital | Current assets minus near-term obligations. | Positive is a useful starting goal. Check payment timing; inventory on a shelf can’t fund tomorrow’s payroll. |
| Current ratio | Current assets relative to current liabilities. | Above 1 is a rule of thumb, not a guarantee. Asset quality and the timing of bills still matter. |
| EBITDA | Earnings before interest, taxes, depreciation, and amortization. | Positive and improving against comparable periods and budget. Review debt payments and capital spending separately. |
| Average check size | Revenue generated per guest under this formula. | At or above budget, while watching guest counts. A larger check doesn’t help much if traffic falls sharply. |
| Table turnover rate | How many parties each table serves in a period. | Set targets by daypart and service style. More turns are useful only if guests still get the experience they expect. |
Don’t judge any of these on their own. Food and labor can both appear reasonable, but their combined expense leaves too little for rent and other bills. Similarly, increasing revenue can mask a falling net margin. Read the numbers together. Then decide what changes to make.
More Metrics Worth Tracking (Prime Cost, Inventory Turnover & RevPASH)
Prime cost
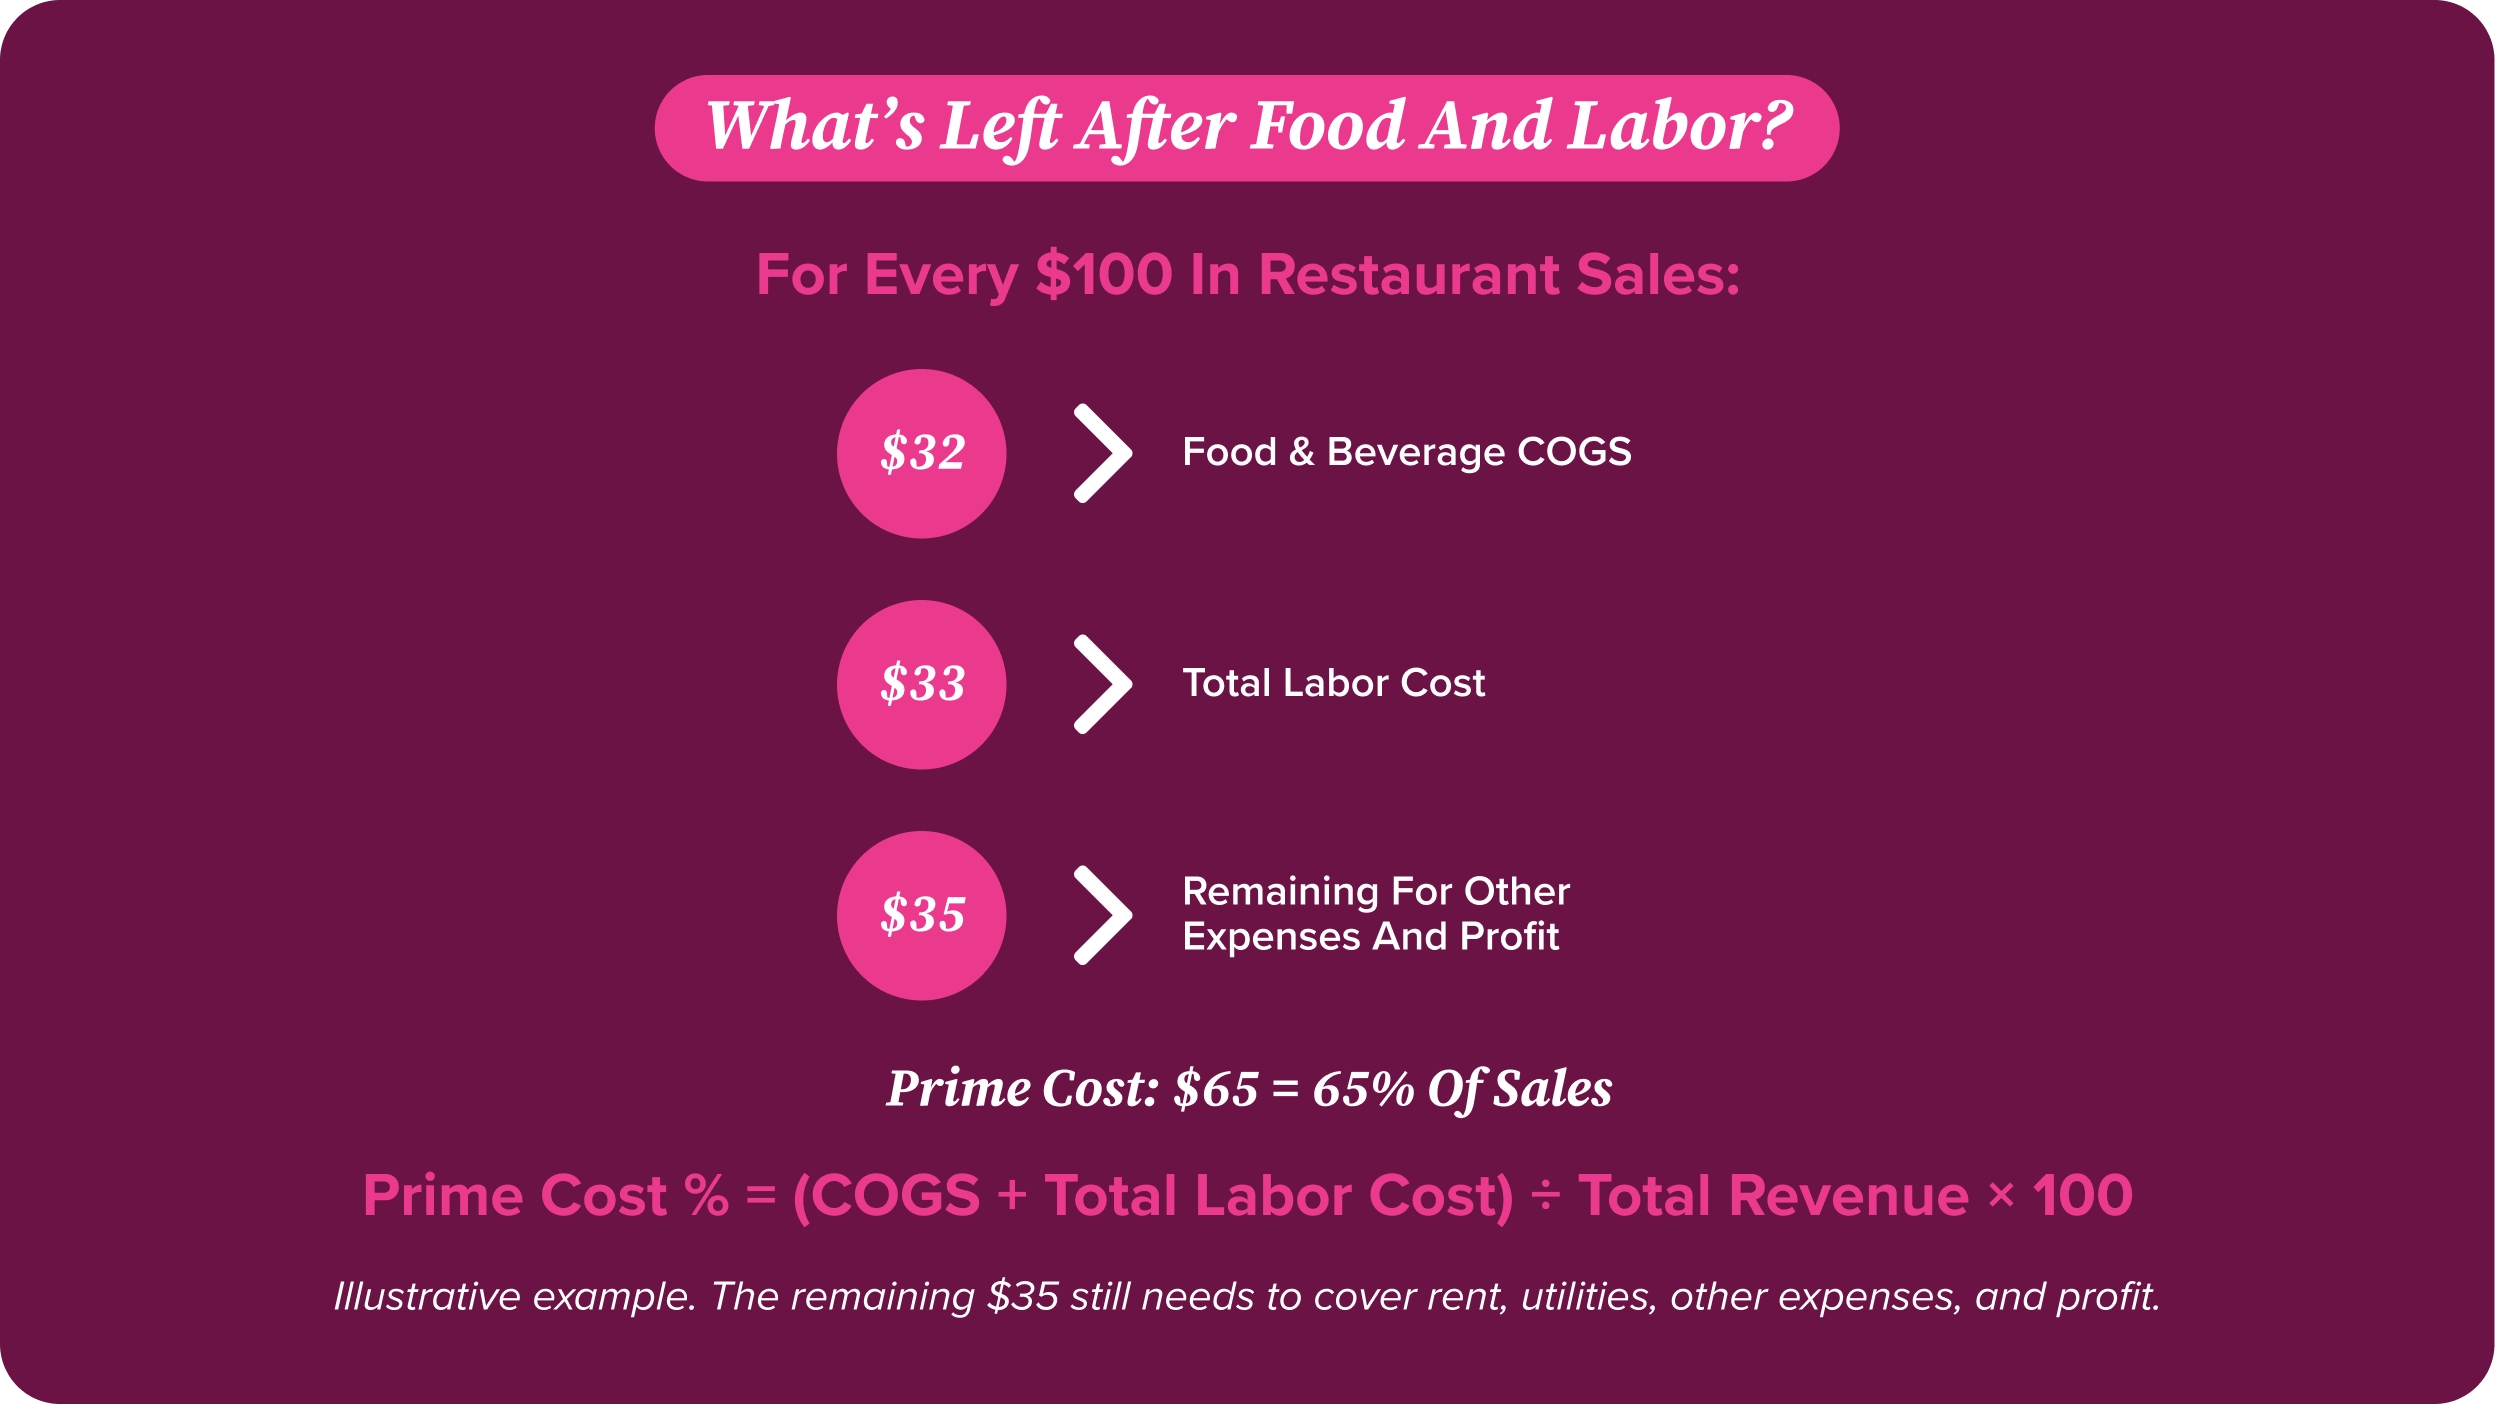
Prime cost = COGS + total labor cost.
And, Prime cost percentage = (COGS + total labor cost) / total revenue x 100.
A starting goal of 60% or less can help frame your budget, but it isn’t a universal cutoff. If food and beverage COGS are 32% of sales and labor is 33%, prime cost is 65%. That leaves 35% for everything else, including profit. Gross profit after prime costs (GPPC) is revenue minus prime cost, not another name for prime cost.
Inventory turnover
Inventory turnover = COGS / average inventory, where average inventory = (beginning inventory + ending inventory) / 2. Use matching time periods. Compare with your own history: slow turnover can signal overbuying, while unusually fast turnover may leave you short during service. Check stockouts and waste alongside the ratio.
RevPASH
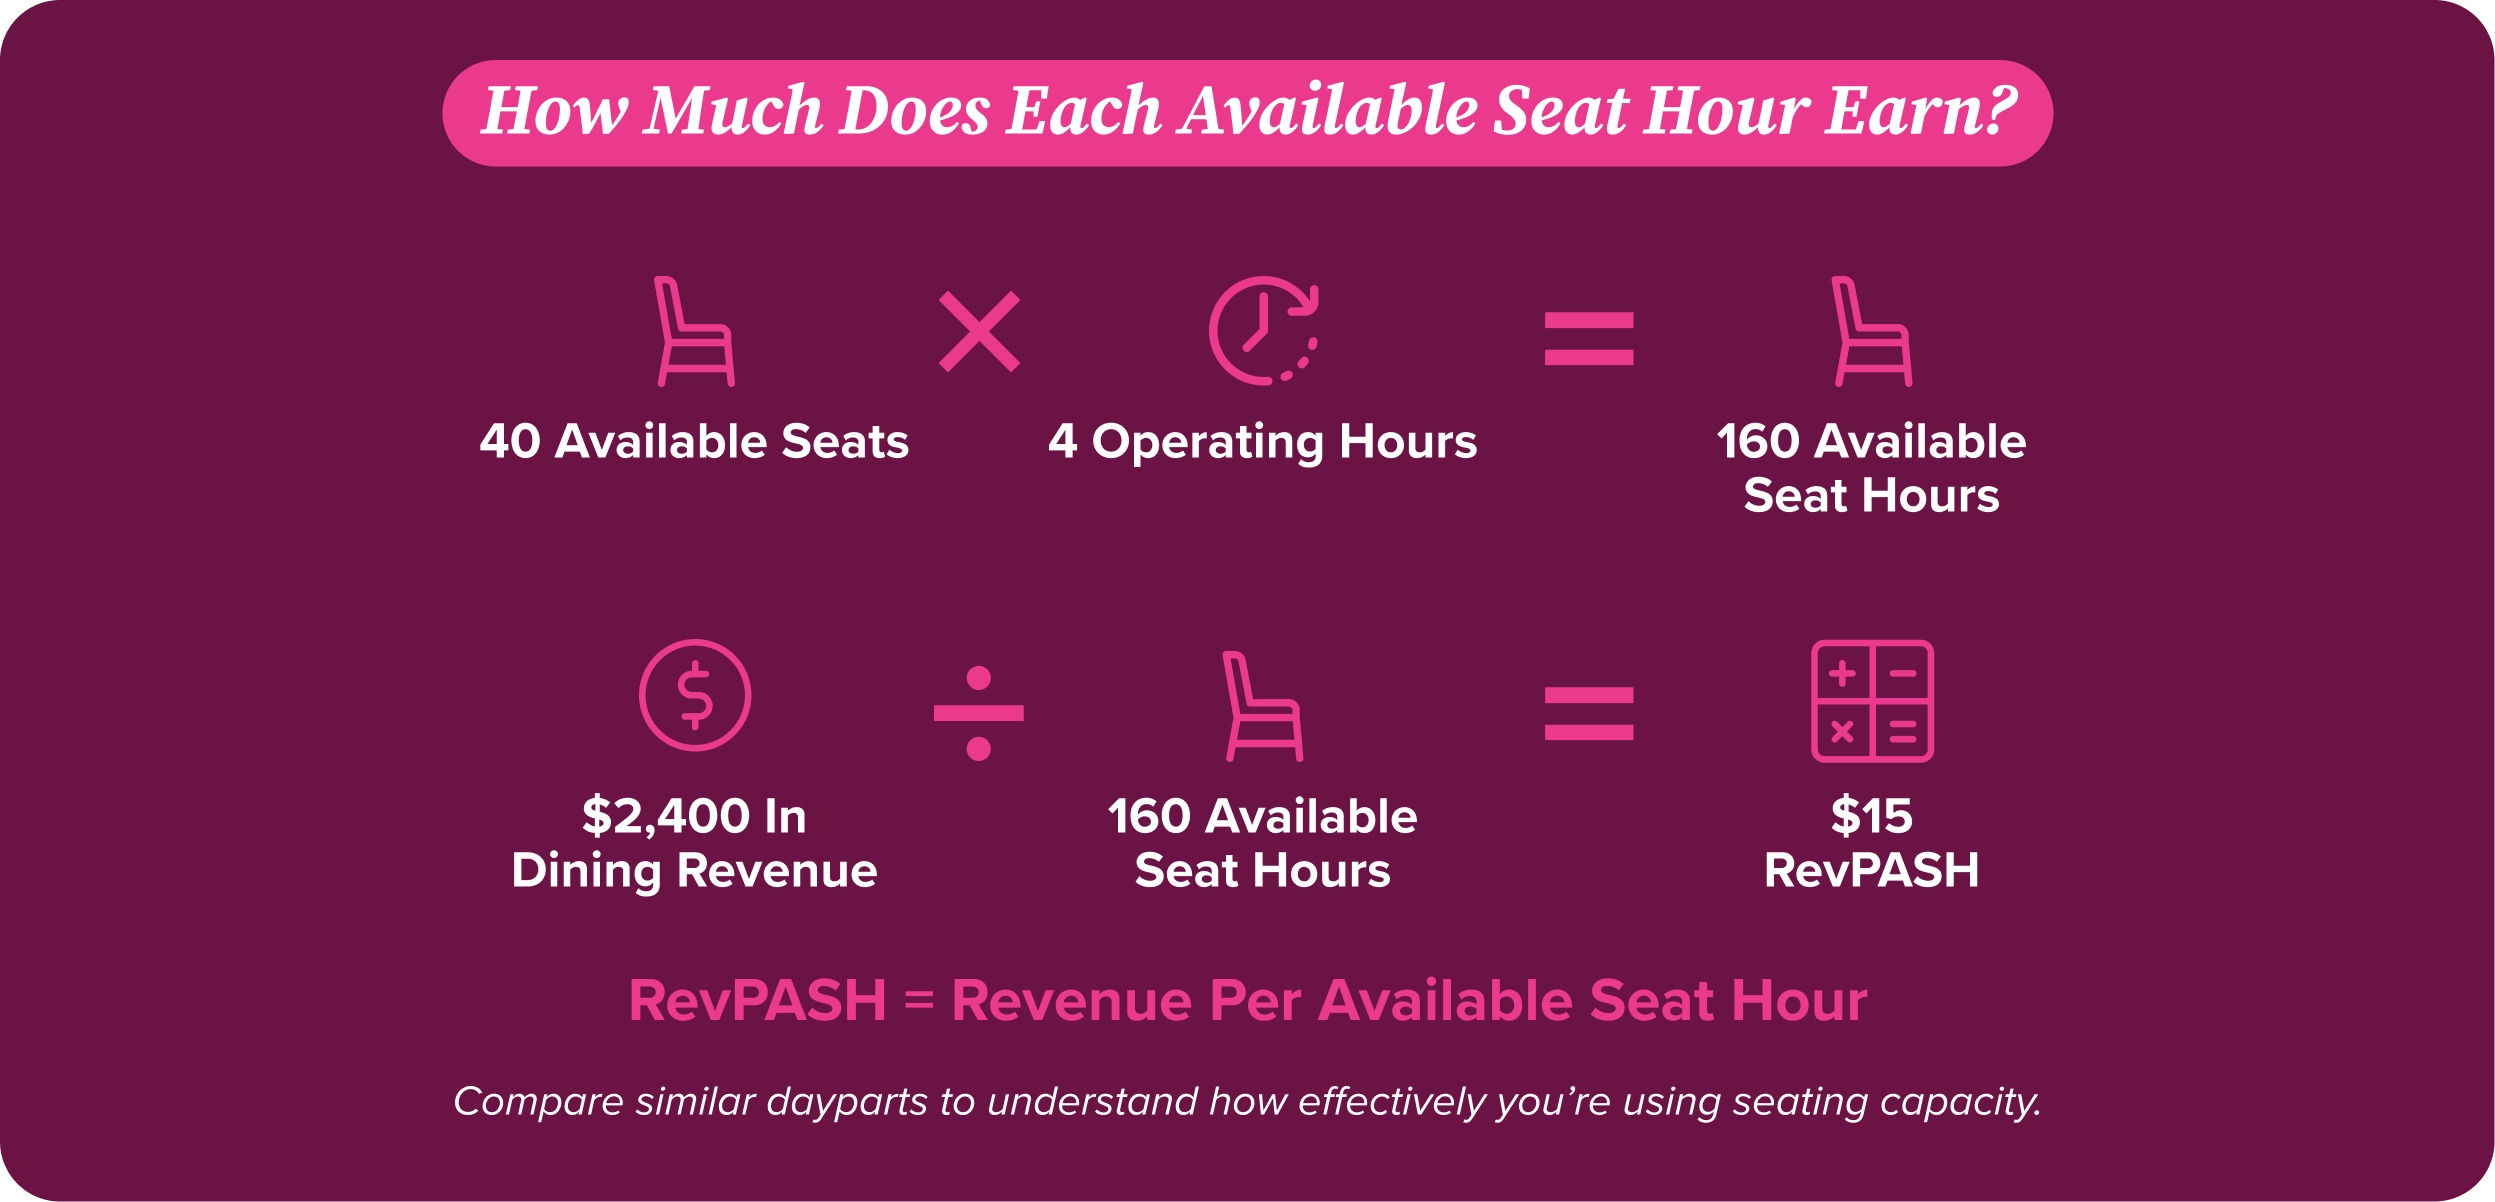
Revenue per available seat hour (RevPASH) = dining revenue / available seat hours. Available seat hours are seats available multiplied by operating hours. For example, $2,400 in dining revenue across 40 seats over four hours equals $15 per available seat hour. Compare similar dayparts to see whether seating capacity is earning its keep.
Which Metrics to Track Weekly vs. Period-End
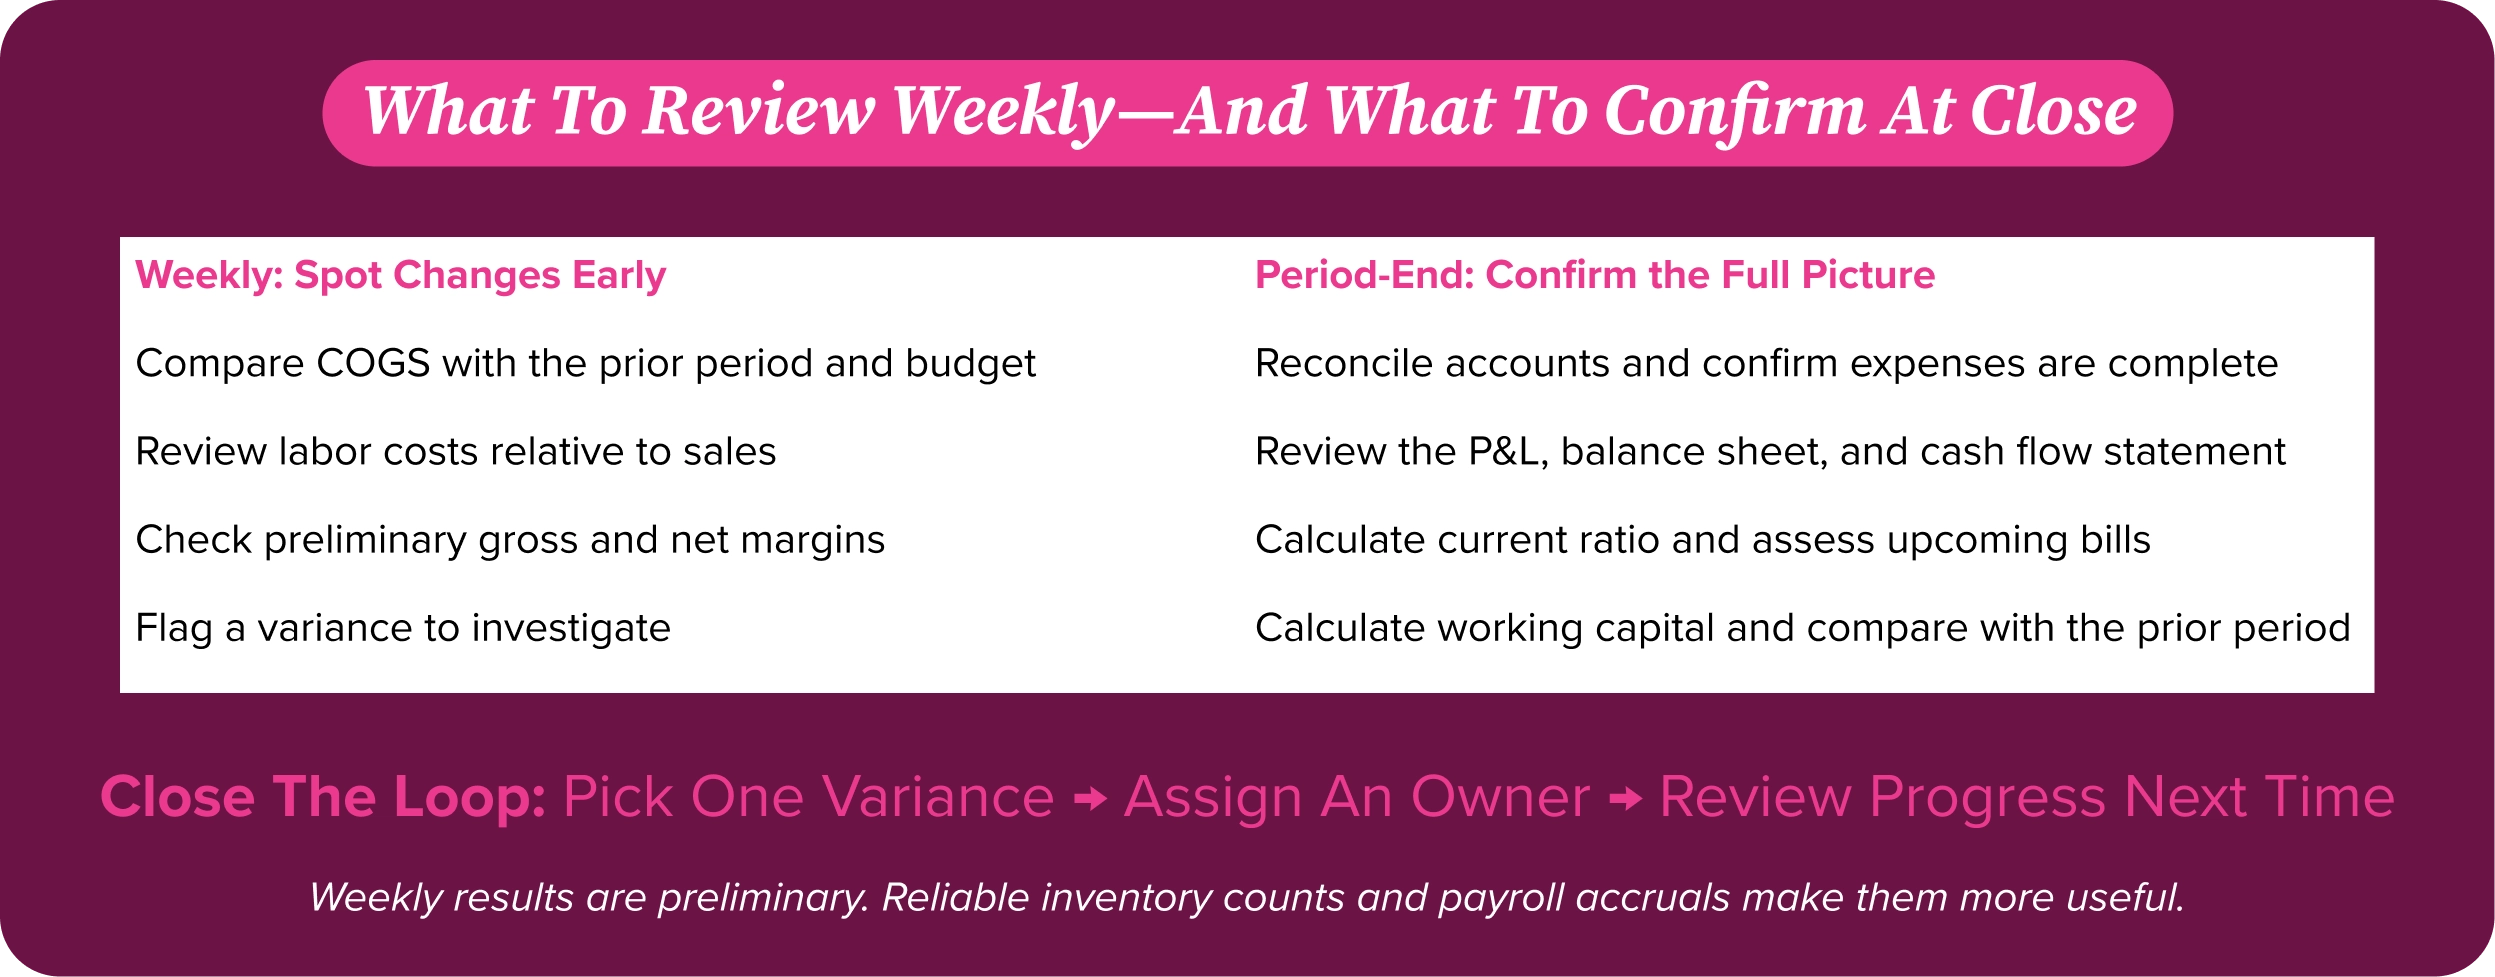
The guide suggests a rhythm: weekly, compare COGS to the previous period and budget, evaluate labor costs in relation to sales, and calculate gross and net profit margins; at period-end, calculate Current Ratio and verify that it is >1 and calculate Working Capital and compare it to the previous period.
Use weekly numbers as an early check, not a substitute for a completed close. Reliable inventory counts and payroll accruals make those comparisons more useful. At period-end, reconcile accounts, confirm expenses are complete, and review the full P&L, balance sheet, and cash flow statement. Pick one variance to investigate, give someone ownership, and check progress at the next review.
Concluding Words
You don’t have to track everything at once. Start with food cost, labor, prime cost, and cash availability. Get those numbers right, review them consistently, and build from there. A report earns its place when it helps you make a better decision.
At Back Office, we help bring restaurant accounting, inventory, labor, and financial reporting into one place, with less manual work between you and the answers you need. Want to see how that could work for your operation? Book a demo with our team and bring the accounting headache you’d most like to take off your plate.
FAQ’s
How do you calculate food cost percentage?
Food Cost Percentage = Cost of Goods Sold / Total Food Sales x 100.
Use food-only COGS for the same period as your food sales. For example, $9,000 in food COGS divided by $30,000 in food sales, multiplied by 100, gives you a food cost percentage of 30%. Purchases alone won’t give you the full picture; beginning and ending inventory matter.
What is a healthy current ratio for a restaurant?
The current ratio is Total Current Assets / Total Current Liabilities. As a general rule, calculate Current Ratio and verify that it is >1.
A ratio of 1.2 means you have $1.20 in current assets for each $1 in current liabilities. Still, look at what those assets are and when bills come due. A ratio above 1 doesn’t automatically mean you have enough available cash.
What is a good food cost / prime cost percentage?
Roughly 28–35% for food cost and 60% or less for prime cost are useful starting targets, not rules for every restaurant. Prime cost includes both COGS and labor. If your food cost looks fine but prime cost is over budget, check labor and beverage costs before assuming food purchasing is the problem.
What is prime cost in a restaurant?
Prime cost combines your cost of goods sold with total labor cost. Include food and beverage COGS, plus wages, employer payroll taxes, and benefits using a consistent definition. Divide the combined amount by total revenue and multiply by 100 to get the prime cost percentage. It shows how much of each sales dollar goes to the products you serve and the people serving them.