


Restaurant budgeting turns financial goals into a practical plan for running the business. It shows how much revenue you expect to generate, where that money needs to go, and what should remain as profit. More importantly, a useful budget helps you make decisions before costs get out of hand. With accurate accounting, consistent bookkeeping, and visibility into food and labor costs, restaurant budgeting becomes more than an annual exercise. It becomes a tool you can use every week.
What Is a Restaurant Budget?
A restaurant budget is a financial plan that estimates revenue, expenses, cash needs, and profit for a specific period. It typically includes sales projections alongside expected food, beverage, labor, occupancy, marketing, technology, and administrative costs.
While a budget may cover an entire year, it should also break those numbers into monthly or weekly targets. That makes the plan easier to compare against actual results. Effective restaurant budgeting gives operators clear financial guardrails without locking them into a plan that no longer reflects the realities of the business.
Restaurant Budget vs. Restaurant Forecast vs. P&L
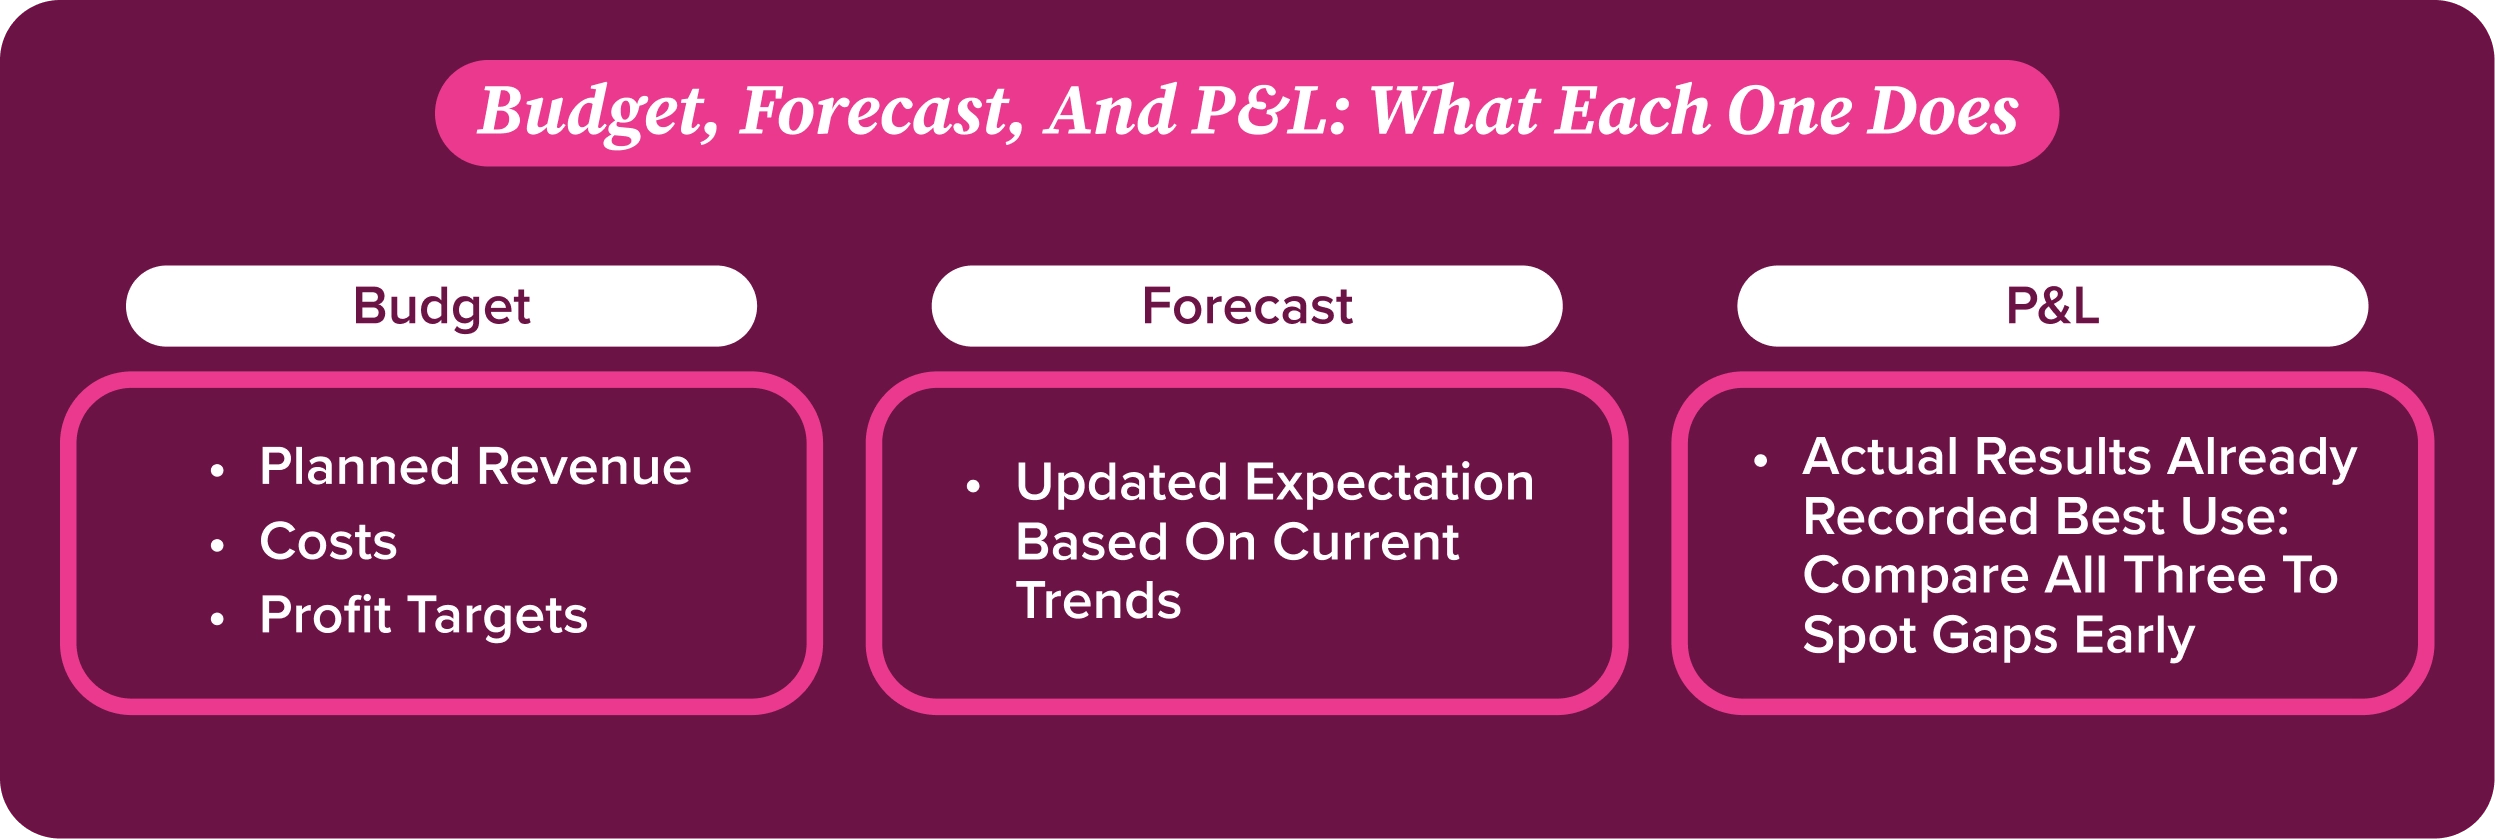
A budget establishes what a restaurant plans to earn and spend. A forecast estimates what is now likely to happen based on current sales, costs, and operating conditions. A profit and loss statement, or P&L, records what has already happened during a specific period.
The three work best together. Your budget sets the target, your forecast adjusts expectations, and your P&L shows actual performance. Comparing all three helps explain whether the restaurant is on track, where assumptions have changed, and which areas require attention before a small variance becomes a larger financial problem.
Why Restaurant Budgeting Is Critical for Profitability
Restaurant profitability rarely disappears through one dramatic expense. More often, it slips away through higher ingredient prices, extra labor hours, waste, service fees, and dozens of smaller variances. Restaurant budgeting helps operators see those problems sooner and respond with more control.
Control Operating Costs
A detailed budget assigns targets to each cost category. Managers can see what they have available to spend instead of waiting until the end of the month to learn that costs ran high.
Protect Profit Margins
Building profit into the budget makes it an intentional target, not whatever happens to remain after every bill is paid. It also shows how changes in sales or costs may affect that target.
Improve Cash Flow Planning
A restaurant can appear profitable and still struggle with cash. Budgeting helps anticipate payroll, rent, taxes, insurance payments, equipment purchases, and seasonal dips before those obligations come due.
Identify Spending Variances Early
Regular budget-to-actual comparisons reveal where performance is drifting. A higher food-cost percentage, an unexpected overtime spike, or a growing technology bill is easier to address when it first appears.
What Should a Restaurant Budget Include?
A restaurant budget should capture the full cost of operating the business, including expenses that do not occur every week. Leaving out irregular or less-visible costs can make projected profit look healthier than it really is.
Food and Beverage Costs (COGS)
Cost of goods sold, or COGS, includes the food and beverages used to produce what the restaurant sells. The budget should account for ingredient prices, purchasing volume, vendor changes, waste, spoilage, discounts, transfers, and inventory adjustments. Separating food and beverage costs may provide a clearer view of performance.
Labor and Payroll Costs
Labor includes hourly and salaried wages, overtime, bonuses, payroll taxes, benefits, workers’ compensation, and other employee-related expenses. Restaurant payroll can be complicated by tipped wages, multiple pay rates, and changing schedules, so the budget should reflect the restaurant’s actual staffing model.
Occupancy and Fixed Costs
Include rent or mortgage payments, common-area charges, utilities, property taxes, maintenance contracts, licenses, and recurring service agreements. Fixed does not always mean unchanged, so review renewal terms and expected rate increases.
Marketing Spend
Budget for paid media, social media, photography, promotions, loyalty programs, email platforms, community partnerships, and agency support. Marketing expenses should connect to measurable goals, whether that means generating traffic, increasing repeat visits, or supporting a new location.
Technology and Operating Costs
POS systems, scheduling tools, online-ordering platforms, accounting software, merchant fees, delivery commissions, office supplies, cleaning products, and repairs belong in the budget too. Review subscriptions regularly because small monthly fees have a habit of quietly piling up.
Taxes, Insurance, and Other Expenses
Plan for income and sales taxes, payroll obligations, general liability insurance, property insurance, professional fees, bank charges, and permits. A bookkeeping process that keeps these expenses properly categorized makes future restaurant budgeting far more accurate.
Capital Expenditures and Equipment
Large purchases such as ovens, refrigeration units, furniture, vehicles, and major renovations require separate planning. Include expected purchase dates, installation costs, financing payments, and a reserve for equipment that may need to be replaced unexpectedly.
Restaurant Budget Benchmarks by Category
Benchmarks can provide a useful starting point, but they shouldn’t replace your restaurant’s own data. Concept, menu mix, service model, location, sales volume, and operating hours all affect what a healthy cost structure looks like.
Food Cost Percentage
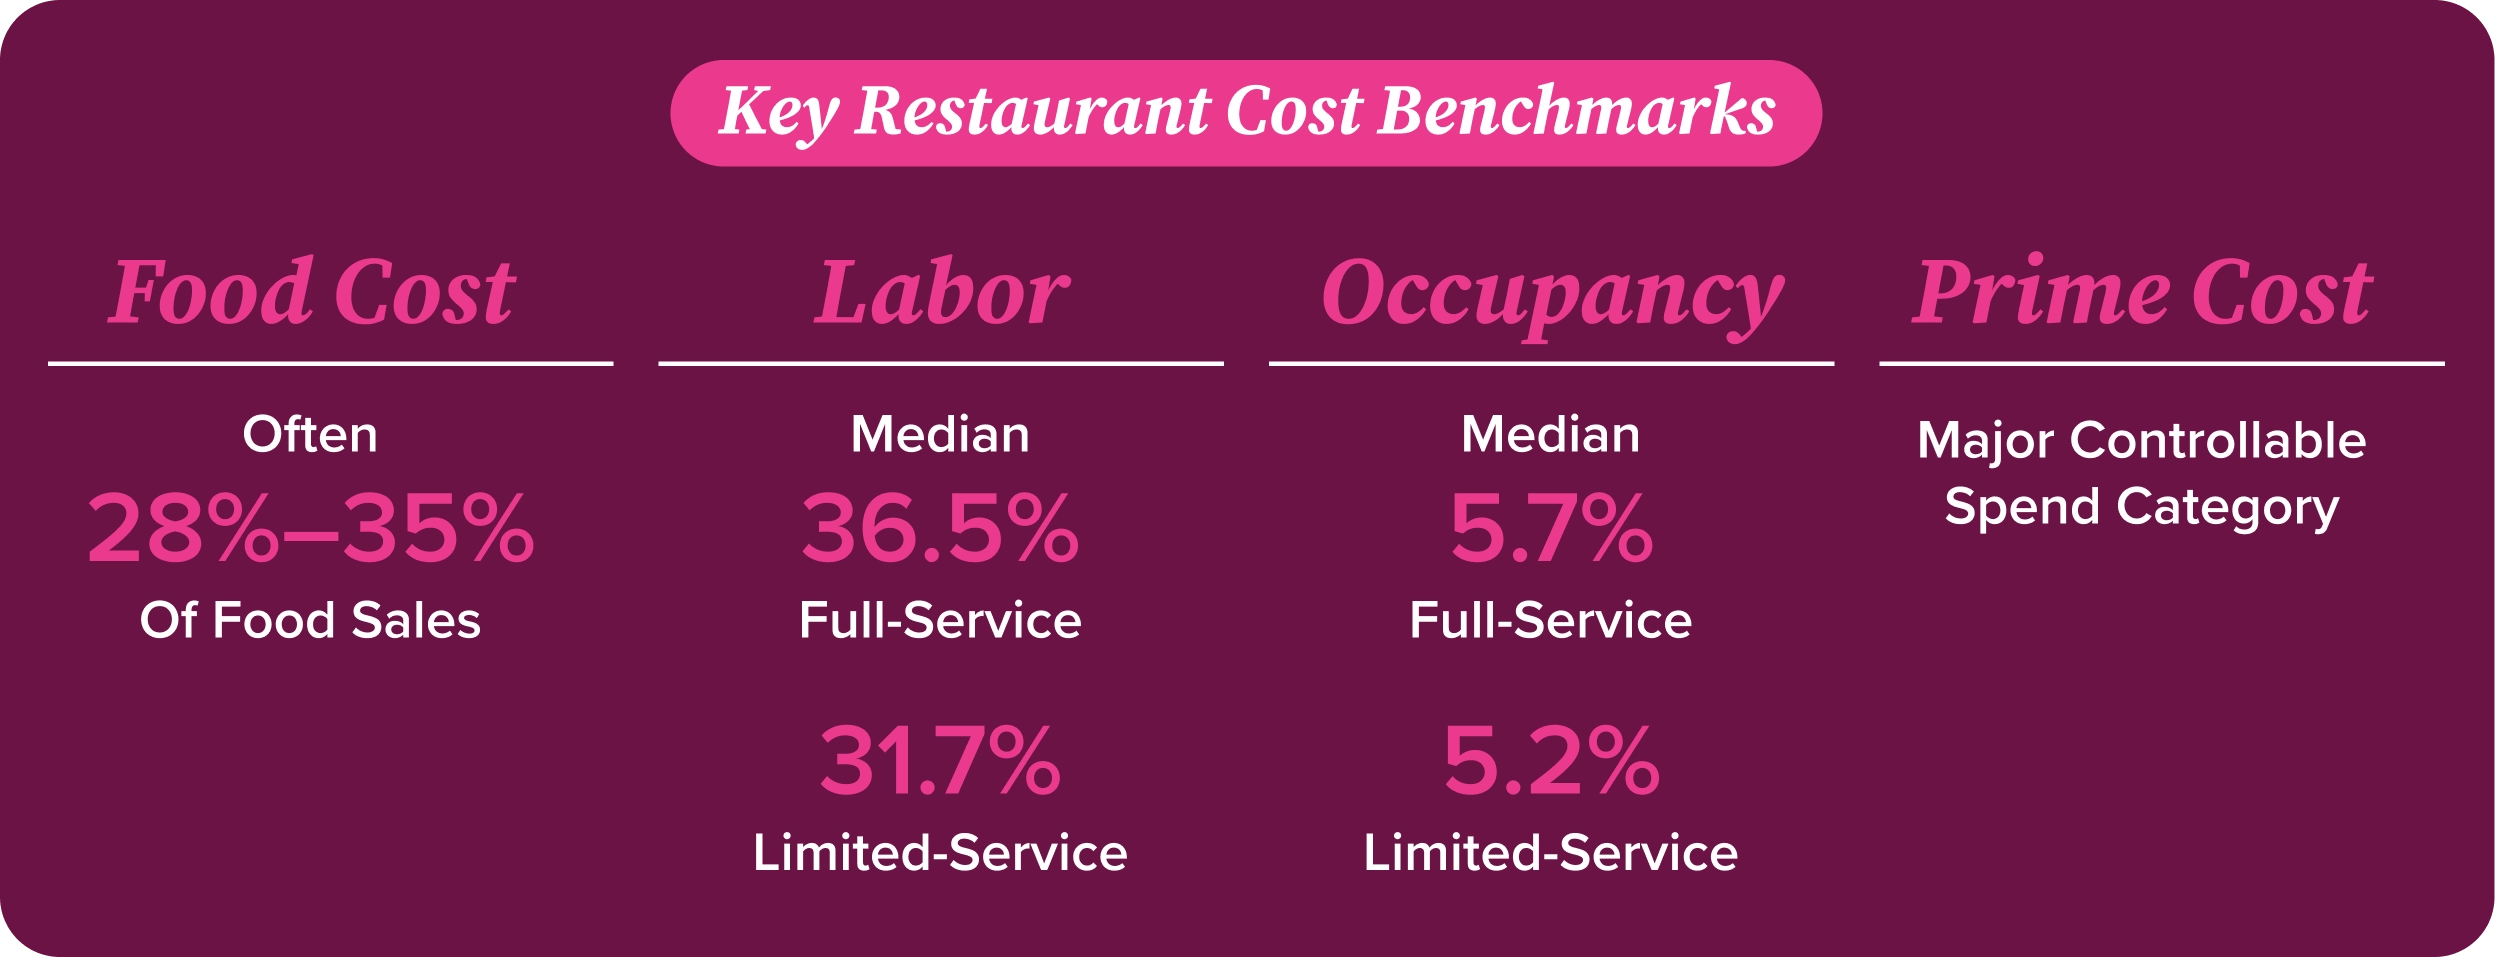
Food cost percentage is calculated by dividing food COGS by food sales and multiplying by 100. Many restaurants use a general range of 28% to 35%, but the right target depends on menu pricing, ingredients, portion size, waste, and concept. A steakhouse and a coffee shop shouldn’t be expected to produce the same result.
Labor Cost Percentage
Labor cost percentage compares total labor expenses with sales. According to the National Restaurant Association, salaries and wages, including benefits, represented a median of 36.5% of sales for full-service operators and 31.7% for limited-service operators in 2024. Treat those figures as context, not automatic targets.
Prime Cost
Prime cost combines COGS and labor, the two largest controllable expenses for most restaurants. The National Restaurant Association reported that food, beverage, and labor represented a median of 65 cents of every sales dollar for limited-service restaurants in 2024.
Occupancy and Overhead Costs
Occupancy includes rent, property costs, and related expenses. In 2024, median occupancy costs were 5.7% of sales for full-service restaurants and 5.2% for limited-service restaurants, though location can make that number vary significantly.
The 60/40 Rule and the 30/30/30/10 Rule
The 60/40 rule suggests using roughly 60% of revenue for prime cost and leaving 40% for overhead and profit. The 30/30/30/10 rule divides revenue among food, labor, operating expenses, and profit. Both can offer quick reference points, but neither is a substitute for restaurant budgeting based on your actual concept and financial history.
How to Create a Restaurant Budget: Step-by-Step
You don’t need a perfect prediction of the next 12 months. You need a plan built from reliable information, reasonable assumptions, and targets your team can monitor.
Step 1: Review Historical Sales and Cost Data
Start with recent P&Ls, sales reports, payroll records, invoices, bank activity, and food cost reports. Look beyond annual totals. Weekly and monthly data can uncover timing patterns, unusual expenses, and gradual cost increases that a year-end summary may hide.
Step 2: Forecast Revenue
Estimate revenue by channel, such as dine-in, takeout, delivery, catering, and events. Consider average check, guest counts, operating days, seating capacity, local conditions, and planned menu changes. Keep the assumptions realistic. An ambitious goal is useful only when there is a credible plan behind it.
Step 3: Account for Seasonality
Identify predictable peaks and slow periods. Weather, holidays, school calendars, tourism, sporting events, and local business patterns can all affect demand. Seasonality may also influence staffing, inventory levels, utility use, and marketing spend.
Step 4: Set Cost Targets by Category
Assign targets for COGS, labor, occupancy, marketing, technology, and other operating costs. Use your historical performance as the baseline, then adjust for known changes such as wage increases, insurance renewals, supplier pricing, or new software.
Step 5: Build in a Profit Target
Decide what the restaurant needs to retain as profit and work backward. If projected expenses leave too little, determine which assumptions need attention. The answer may involve menu pricing, purchasing, staffing, waste reduction, sales growth, or a combination of improvements.
Step 6: Create Best-Case, Expected, and Worst-Case Scenarios
Build more than one version of the budget. A best-case scenario shows the upside if sales outperform expectations. An expected case reflects the most likely outcome. A worst-case scenario shows what happens if sales soften or major costs rise. Scenario planning can make difficult decisions far less frantic when conditions change.
How to Monitor and Adjust a Restaurant Budget

A budget provides direction only when someone checks it. Once the plan is complete, establish a routine for reviewing performance and assigning responsibility for follow-up.
Compare Budget vs. Actual Performance
Place budgeted and actual results side by side. Compare both dollar amounts and percentages because sales volume can affect how the numbers look. For example, labor spending may meet the dollar budget while still representing too much of lower-than-expected sales.
Identify and Investigate Variances
Focus on meaningful differences instead of chasing every small fluctuation. If food cost is high, look at pricing, purchasing, inventory, waste, portions, and menu mix. If payroll is over budget, examine overtime, scheduling, training hours, and sales per labor hour.
Update Forecasts When Conditions Change
A revised forecast does not erase the original budget. It gives you a more accurate picture of where the restaurant is heading. Update projections when sales patterns, food prices, staffing needs, or other assumptions change materially.
Review the Budget Weekly and Monthly
Weekly reviews help operators catch immediate issues, especially in food, labor, cash, and sales. Monthly reviews provide a broader view of profitability and trends. That rhythm keeps restaurant budgeting connected to everyday operations.
Common Restaurant Budgeting Mistakes to Avoid
Even a detailed budget can mislead the business when its assumptions are weak or nobody follows up. Watch for these common problems.
Relying on Outdated Data
Last year’s numbers may not reflect current wages, menu prices, vendor costs, rent, insurance, or guest behavior. Start with historical data, but update it using current contracts, recent invoices, and realistic sales expectations.
Ignoring Seasonality
Dividing an annual projection evenly across 12 months may produce a tidy spreadsheet and a fairly useless operating plan. Budget revenue and costs around the actual rhythms of the restaurant.
Setting Unrealistic Cost Targets
A cost target should challenge the team without asking them to achieve the impossible. Arbitrary cuts can hurt food quality, service, morale, and the guest experience. Build targets from actual performance and identify the operational changes required to reach them.
Failing to Track Budget vs. Actuals
Creating a budget and filing it away defeats the purpose. Without regular comparison, operators cannot tell whether the restaurant is ahead, behind, or quietly moving in the wrong direction.
Treating the Budget as a Static Document
Supplier prices move. Sales change. Equipment breaks, because restaurant equipment apparently enjoys impeccable timing. Restaurant budgeting should leave room for updated forecasts and informed adjustments while preserving the original goals for comparison.
How BEP Back Office Helps Operators Stay on Budget
BEP Back Office brings accounting, bookkeeping, food cost management, payroll, and financial reporting together in one restaurant-focused platform. Operators can monitor weekly financial performance, cash flow, labor, COGS, inventory usage, ingredient price trends, and budget variances without piecing together disconnected spreadsheets.
Integrations with POS systems, banks, HRIS platforms, and other restaurant technology help keep information consistent across the business. With more timely reporting and restaurant-specific support, operators can spot developing issues, adjust their plans, and make budgeting decisions using current data instead of waiting for month-end surprises. Learn more about BEP Back Office.
FAQs
What should be included in a restaurant budget?
A restaurant budget should include projected sales, food and beverage COGS, payroll, benefits, occupancy, utilities, marketing, technology, insurance, taxes, repairs, professional services, debt payments, and capital expenditures. It should also include a clear profit target and a reserve for unexpected costs.
How much should a restaurant budget for food costs?
Food cost targets commonly fall between 28% and 35% of food sales, but there is no universal percentage. Menu format, ingredient quality, pricing, purchasing terms, waste, and portion control all influence the right target. Use your restaurant’s theoretical and actual food costs to set a more meaningful benchmark.
How much should a restaurant budget for labor?
Labor budgets vary by service model and staffing needs. National Restaurant Association data placed 2024 median labor costs at 36.5% of sales for full-service restaurants and 31.7% for limited-service restaurants. Operators should create targets using their own sales patterns, wage rates, benefit costs, and service requirements.
How often should a restaurant review its budget?
Review sales, food cost, labor, and cash performance weekly. Complete a more detailed budget-to-actual and P&L review monthly. Update the forecast whenever a significant change makes the existing assumptions unreliable.
What’s the difference between a restaurant budget and a P&L statement?
A restaurant budget describes what the business expects to earn and spend. A P&L statement reports the revenue, expenses, and profit the restaurant actually recorded. Comparing the two shows where actual performance differed from the plan.
What is the 30/30/30/10 rule for restaurants?
The 30/30/30/10 rule is a general guideline that allocates 30% of revenue to food costs, 30% to labor, 30% to overhead, and 10% to profit. It can be a helpful starting point, but restaurant budgeting should ultimately reflect the concept’s real numbers rather than forcing every operation into the same formula.