
Food cost percentage shows how much of your restaurant’s food sales goes toward food and ingredient costs. Use the calculator to find your food cost percentage for any period you track. Tracking food cost over time helps you understand how efficiently your restaurant turns food purchases into revenue and spot changes that may affect your margins.
Food Cost Percentage Formula
Food Cost % = [(Beginning Inventory + Purchases − Ending Inventory) ÷ Food Sales] × 100
Enter your inventory, purchases, and food sales below to calculate your food cost percentage for any period you track.
Costing out one dish or recipe instead? Use the Recipe Cost Calculator — it's a different tool for a different question.
Food on hand at the start of the period
Food bought during the period
Food on hand at the end of the period
What the food you used actually cost
Same period. Leave out beverage, alcohol, and other sales.
Food cost percentage
—
Enter all four numbers to see your food cost %.
Over target? Cost your top sellers in the Recipe Cost Calculator to see which dishes drive it.
Drag to set the food cost % you're aiming for.
No single “right” food cost percentage fits every restaurant. Industry guidance puts food cost between 28% and 35% of sales, and the median US restaurant lands around 32%. Your ideal range depends on your concept, menu mix, ingredient costs and pricing. Use these benchmarks as a starting point, then compare your actual food cost with what your menu should theoretically cost.
| RESTAURANT TYPE | MEDIAN FOOD COST % |
|---|---|
| Full-service, $2M+ in sales | 31.0% |
| Full-service, under $2M in sales | 33.7% |
| All full-service | 32.0% |
| Limited-service (quick-service, fast casual, counter) | 32.4% |
Source: National Restaurant Association, 2025 Restaurant Operations Data Abstract (2024 data). Food and non-alcoholic beverage cost as a share of sales.

A food cost percentage shouldn’t be evaluated in isolation. As an accountant, I also look at labor, waste and other operating costs to understand how food cost fits into the bigger picture. A percentage that works for one restaurant may not work for another if the overall cost structure doesn’t support profitability.”
Accounting Specialist, Back Office
Calculating your food cost percentage is only the starting point. Tracking how it changes, understanding what’s driving it, and knowing where to take action can help protect your restaurant’s margins.
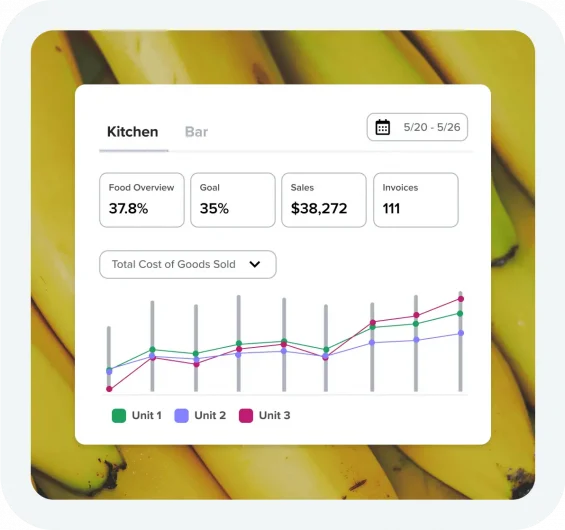
A single food cost calculation shows how your restaurant performed during one period. Tracking food cost consistently over time makes it easier to spot when costs are moving in the wrong direction and investigate why.
Compare results week over week using the same calculation. If food cost rises from 29% to 31% to 33%, that trend is worth investigating even if each percentage falls within a typical range for your concept.
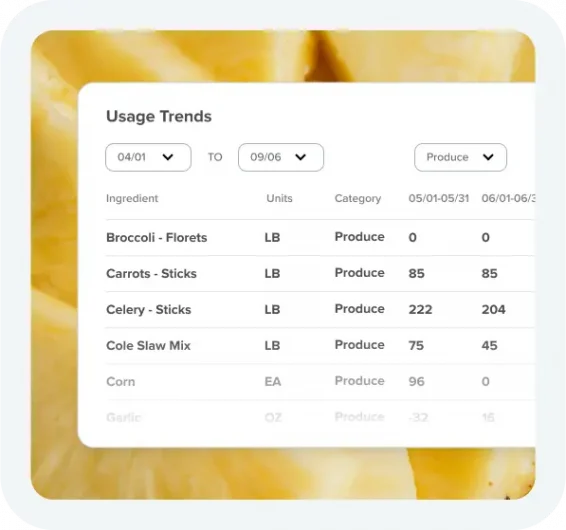
Ingredient prices, purchasing, inventory, waste, portion sizes, menu mix, and sales can all affect food cost. Consistent tracking helps you catch changes before they become bigger margin problems.
Expert Insight
When food cost starts trending in the wrong direction, we first make sure the numbers themselves are accurate. We check inventory counts and values, purchases and pack sizes before looking for an operational cause. From there, focus on the higher-value ingredients contributing most to COGS rather than chasing every small variance. That helps narrow down whether the issue is waste, prep, purchasing or another operational process.
Onboarding Manager, Back Office
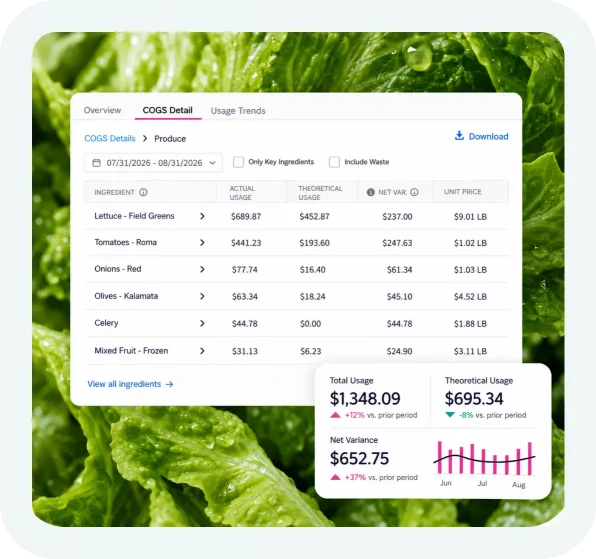
Knowing what you spent is useful. Knowing what you should have spent helps you find the gap.
Your actual food cost shows what you really spent on food relative to sales. Your theoretical food cost estimates what you should have spent based on your recipes, ingredient costs, portion sizes, menu mix, and actual items sold.
Comparing the two reveals your food cost variance, which can help uncover where magin is being lost. Some variance is normal. What matters is how large the gap is, how it changes over time, and what’s causing it.
Expert Insight
A steady food cost climb over several periods can quietly eat away at your margins while individual cost calculations could still look acceptable. Tracking food cost over time and staying up on your food cost trend gives you a chance to address the problem before it settles in.”
QA Engineer, Back Office
Lowering food cost starts with understanding what’s driving it. Track waste, standardize recipes and portions, monitor ingredient prices, and compare purchasing and inventory against what you’re actually using.
When food cost starts moving in the wrong direction, look beyond the percentage itself. Changes in waste, portioning, purchasing, inventory, employee meals, and receiving practices can reveal where costs are creeping up and where you have the most opportunity to improve.
Expert Insight
Accurate inventory starts with consistency. Count at the same time of day and, whenever possible, with the same person each period. Even missing an item from one week to the next can distort usage and create a false food cost number. Once you trust the numbers, you can investigate what’s behind them, from waste and employee meals to deliveries that weren’t properly checked in.”
Customer Success Team Lead, Back Office
2-3%
Operators using Back Office have seen a 2-3% improvement in food costs across their business.
20%
Back Office members have seen a 20% reduction in food waste within the first 3 months of using our food costing software.
14%
First year members see, on average, up to a 14% increase in NET profit when using our tools.
See Where Food Waste Is Eating Into Your Margins
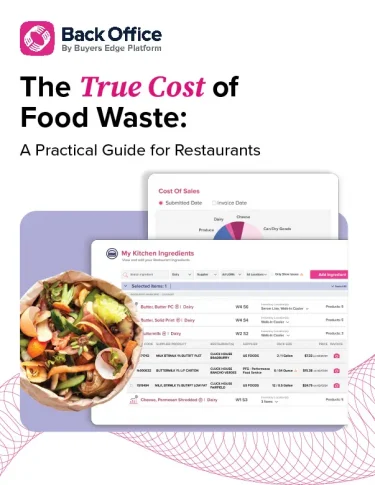
Your food cost percentage can tell you there’s a problem. The True Cost of Food Waste helps you dig into one of the places those costs can hide.
Learn where food waste commonly happens across your operation, how it impacts profitability, and practical ways to reduce waste across ordering, prep, inventory, and daily execution.
Everything you need to know about food costs!
Your food cost percentage is the share of your food sales spent on food and ingredient costs for a given period. For example, a 30% food cost means 30 cents of every sales dollar went to food.
Actual food cost comes from your real inventory numbers: what you bought, used, and have left. Theoretical food cost comes from your recipes: what your costs should be if every dish was made exactly to spec. The gap between the two usually points to waste, theft, or portioning problems.
Food Cost % = (Beginning Inventory + Purchases − Ending Inventory) ÷ Food Sales × 100.
To calculate a recipe's food cost, add up what each ingredient costs, then divide by the number of portions it makes. The Recipe Cost Calculator does this automatically.
You take the same approach as a recipe: total ingredient cost divided by portions, compared against what you charge for the item.
You should calculate your food costs weekly, especially for high-volume ingredients or during periods when food prices are moving.
When your food cost percentages are high, the obvious suspects are waste, theft, and over-portioning. Less obvious culprits include an inaccurate inventory count or a supplier price increase that hasn't been reflected in your menu prices yet.
Expert Insight
“One of the things I see operators miss most often is portion creep. It’s usually not dramatic over-portioning, but small inconsistencies that compound across thousands of plates. A little extra protein, a heavier sauce pour, or staff eyeballing ingredients can have a meaningful impact on food cost without ever appearing as obvious waste.
Recipe drift can create the same problem. A recipe may call for a 6-ounce portion, but over time the kitchen gradually starts serving 7 or 7.5 ounces. The theoretical food cost still looks right on paper, while the actual food cost tells a very different story.”
Ryan French
Account Manager, Back Office
Food cost only covers what you spend on food and ingredients. Labor is tracked separately, and the two combine into prime cost, one of the most-watched numbers in restaurant finance.
Expert Insight
“Operators confuse food cost and prime cost more often than you might think, especially independent owners, first-time operators, and chef-owners. The problem is that it can send them looking for savings in the wrong place. They may cut portions or change vendors when labor scheduling is actually driving the profitability issue. Keeping the two metrics separate makes it much easier to see what’s actually affecting margins.”
Chad Knoth
Account Success Manager, Back Office

Reach out today and one of our local reps will contact you to discuss your goals.
Looking for more solutions? Explore other helpful calculators below.